

Natural Gas, Bullish Engulfing, Moving Averages – Technical Update:
- Natural gas prices could be readying for a turn higher
- A bullish engulfing is in focus on the daily setting
- Keep a close eye on the 100-period SMA on the 4-hour
Trade Smarter – Sign up for the DailyFX Newsletter
Receive timely and compelling market commentary from the DailyFX team
Subscribe to Newsletter
Daily Chart – Bullish Engulfing in Focus
Natural gas price volatility has notably cooled in recent days with the heating commodity appearing to stabilize after persistent losses earlier this year. Prices have been unable to clear the current 2023 low (which is also the February low) at 1.967. At the same time, positive RSI divergence has been showing that downside momentum has been fading.
Meanwhile, it appears that a Bullish Engulfing candlestick pattern has emerged over the past 24 hours. At the time of publishing, upside follow-through was lacking. Still, further gains from here could open the door to a turn higher. That would place the focus on the 50-day Simple Moving Average (SMA). The latter could hold as resistance, maintaining the downside focus.
Otherwise, continuing higher from here may open the door to rising back to the February peak at 3.027. To get a better idea of how the near-term technical landscape is shaping up, we can look at the 4-hour setting.
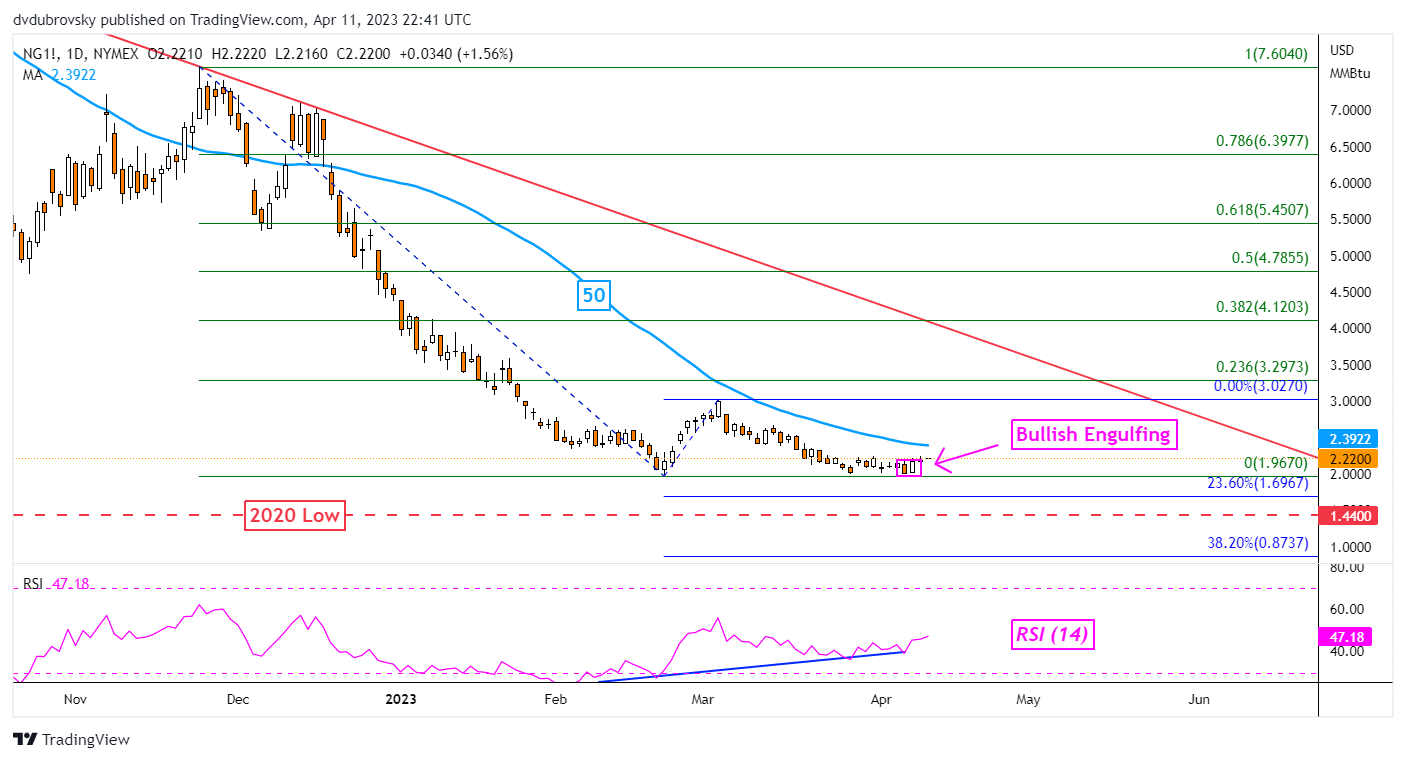
Chart Created Using TradingView
4-Hour Chart – Prepping for Breaking Higher?
Zooming in on the 4-hour setting, we can see that natural gas has been struggling to mind meaningful upside progress ever since breaking through a bullish Felling Wedge chart formation. The commodity has been restrained by the 78.6% Fibonacci retracement level at 2.195 on multiple occasions now since the end of March.
Now it seems that prices could be readying for a turn higher. While follow-through is still lacking, natural gas pushed above the 100-period SMA in this timeframe. This has exposed the 61.8% Fibonacci retracement level at 2.373. Further gains from there would place the focus on the midpoint at 2.498. Otherwise, a turn lower would pivot prices back to the February low.
Recommended by Daniel Dubrovsky
The Fundamentals of Breakout Trading
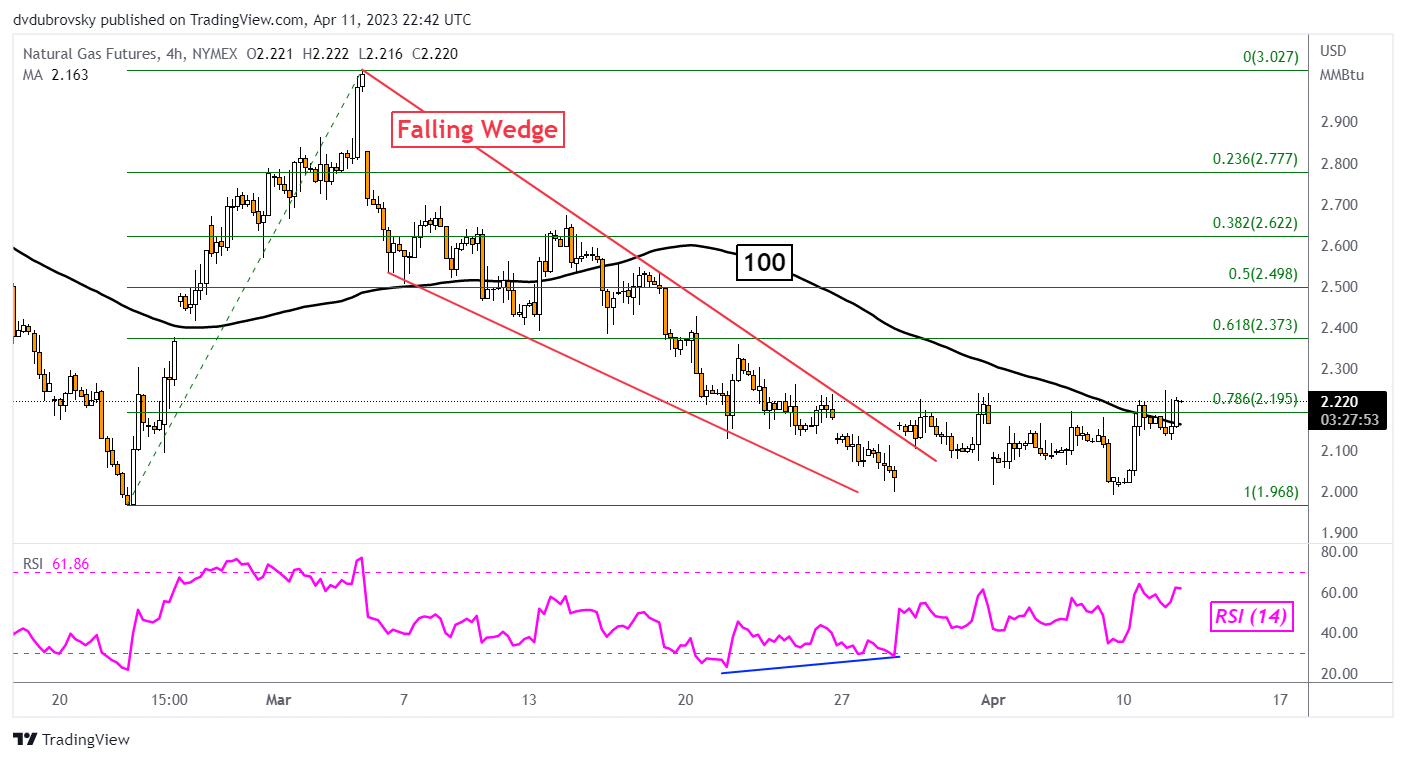
Chart Created Using TradingView
— Written by Daniel Dubrovsky, Senior Strategist for DailyFX.com
To contact Daniel, follow him on Twitter:@ddubrovskyFX
Comments are closed.