

Natural Gas, NG – Price Outlook:
- Low market diversity and positive divergence as natural gas prices test the February low.
- Odds are rising of at least some consolidation / minor rebound.
- What are the signposts to watch?
Recommended by Manish Jaradi
Get Your Free Top Trading Opportunities Forecast
NATURAL GAS TECHNICAL OUTLOOK: BULLISH
Natural gas prices are holding above strong support, raising the prospect of at least some consolidation / minor rebound as the downward momentum is fading.
Market diversity as measured by fractal dimensions appears to be low as natural gas retests multi-month lows. Fractal dimensions measure the distribution of diversity. When the measure hits the lower bound, typically 1.25-1.30 depending on the market, it indicates extremely low diversity as market participants bet in the same direction, raising the odds of a price reversal. For natural gas, the 65-day fractal dimension fell below the threshold of 1.25, flashing a red flag. See “Natural Gas Price Action Setup: Is the Slide Overdone?”, published February 21 for more on the topic.
Natural Gas Daily Chart
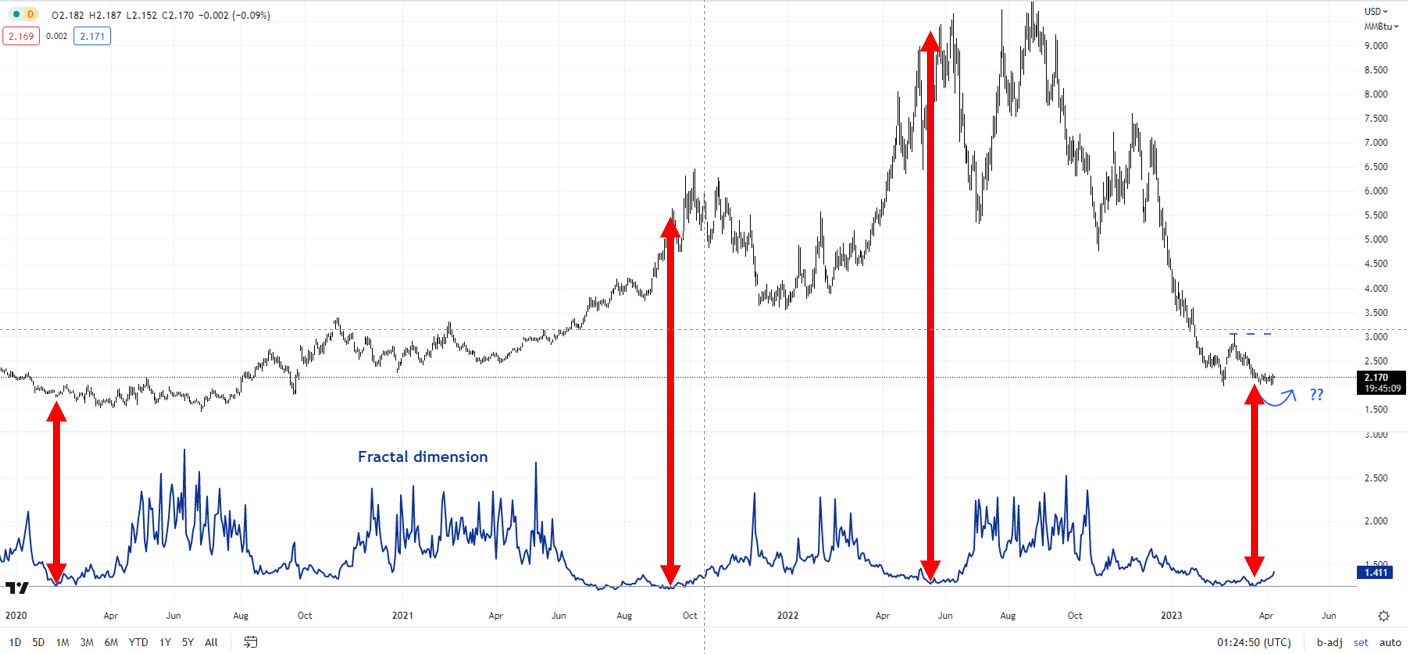
Chart Created by Manish Jaradi using Tradingview
A positive momentum divergence on the daily and weekly charts (ascending Relative Strength Index associated with a double bottom in natural gas) is a sign that the eight-month-long slide is losing momentum. Moreover, speculative short positioning has reduced sharply since March even as natural gas prices are hovering around 2.5-year lows.
So far, natural gas is holding above strong support at the February low of 1.97. Furthermore, the colour-coded daily candlestick charts show the most recent leg lower (from early March) is consolidation within the downtrend, and not the start of a fresh leg lower.
Natural Gas Daily Chart

Chart Created by Manish Jaradi using Tradingview
This suggests that the conditions for at least a short-term consolidation/minor rebound are getting ripe. To be fair, natural gas needs to clear the crucial resistance area around 2.25-2.40, including the 89-period moving average, the 200-period moving average, and the upper edge of the Ichimoku cloud on the 240-minute charts. A move above the resistance would raise the odds of a retest of the March high of 3.03. Any break above 3.03, would trigger a double bottom (the February and the March lows), potentially opening the way toward 4.00.
Natural Gas 240-minute Chart
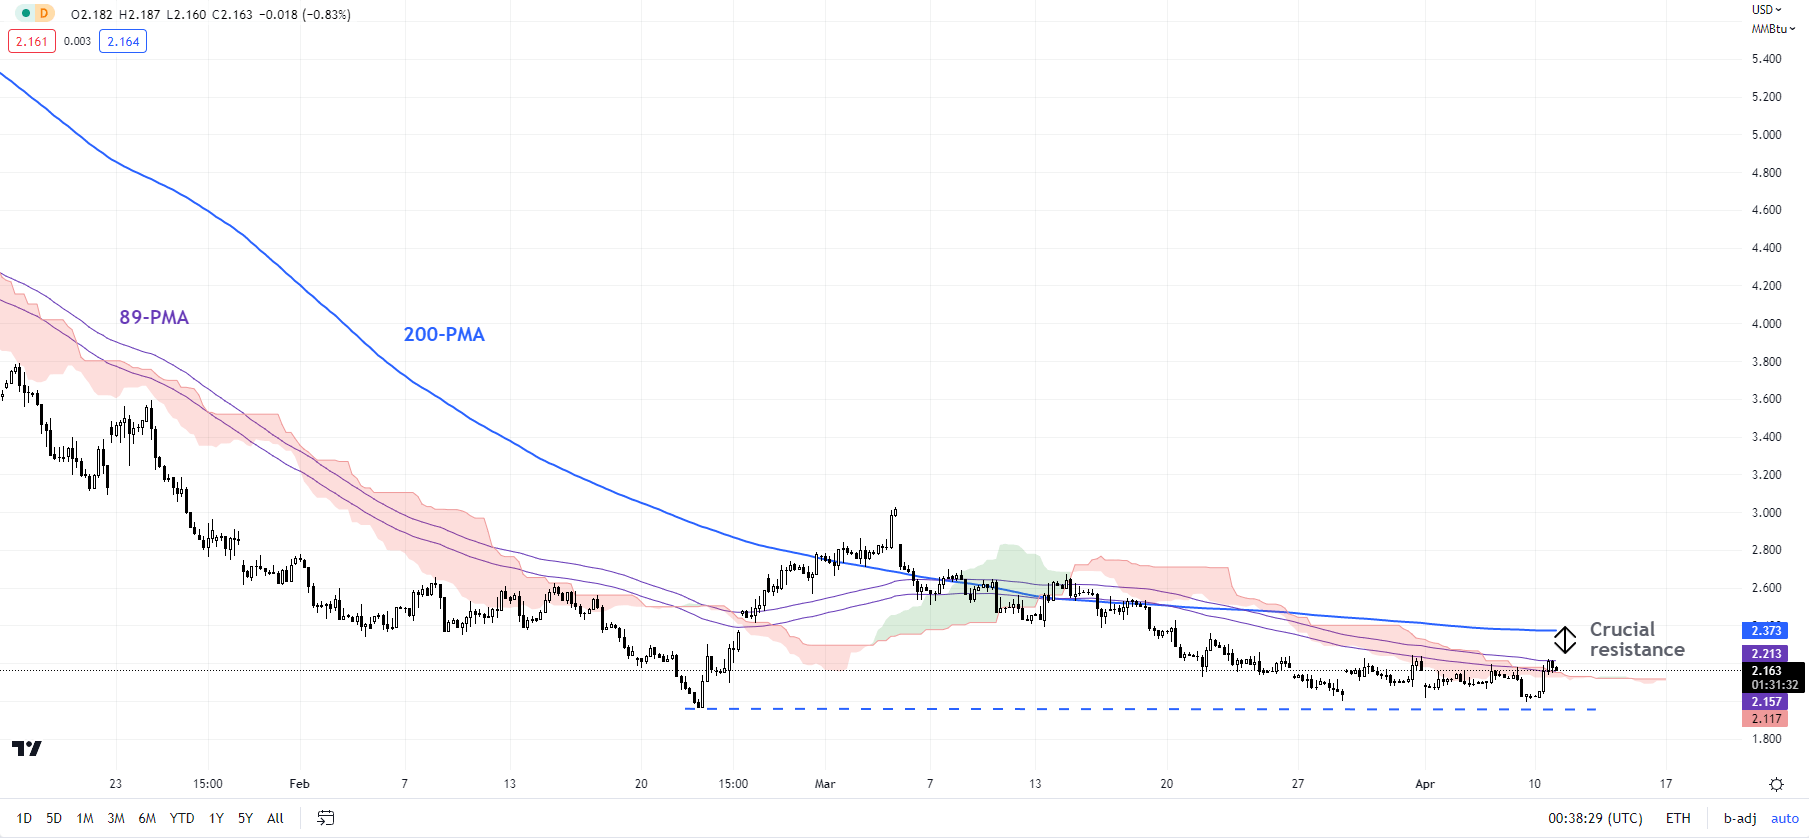
Chart Created by Manish Jaradi using Tradingview
On the downside, a drop below 1.97 could pave the way toward the 2020 low of around 1.45, also the target of a major double-top pattern (the 2022 highs) triggered at the end of last year.
Trade Smarter – Sign up for the DailyFX Newsletter
Receive timely and compelling market commentary from the DailyFX team
Subscribe to Newsletter
— Written by Manish Jaradi, Strategist for DailyFX.com
— Contact and follow Jaradi on Twitter: @JaradiManish
Comments are closed.