Natural Gas Price Plunge Extends, Milder-Than-Expected US Weather in Focus
Natural Gas, US Weather Outlook, 7th Week of Losses? – Technical Update:
- Natural gas prices fell the most on Wednesday since early January
- Milder-than-expected US weather outlook hints at reduced demand
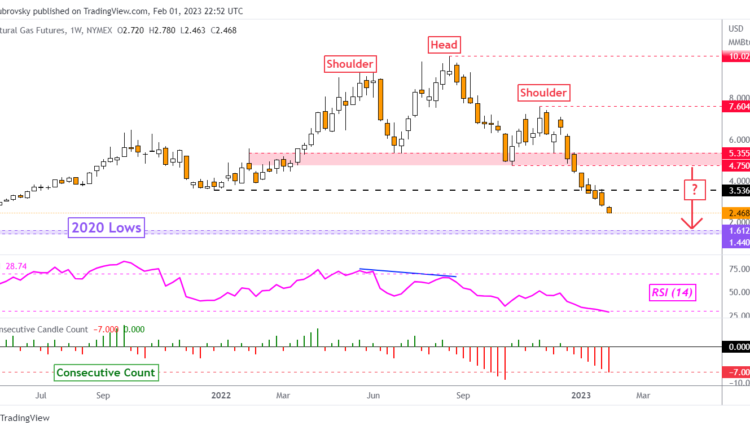
- Bearish Head & Shoulders on the weekly chart keeps hinting at losses
Trade Smarter – Sign up for the DailyFX Newsletter
Receive timely and compelling market commentary from the DailyFX team
Subscribe to Newsletter
Weekly Chart – Prices Plunge on Milder US Weather Outlook
Natural gas prices extended losses over the past 24 hours. According to data from the US National Weather Service, above-normal weather conditions are seen across the central and eastern United States in the week ahead. The higher-than-expected temperatures could result in reduced demand for the heating commodity.
On the weekly chart below, natural gas continues to make downside progress in the aftermath of a bearish Head & Shoulders chart formation. The ultimate target of the formation is the 2020 low, which makes for a key range of support around 1.44 – 1.61. The commodity is now heading for a 7th week of consecutive losses, the most since October. It is down about 13.4% this week so far, the most since early January.
Chart Created Using TradingView
Daily Chart – Worst Drop Since January 5th
On the daily chart, natural gas sank 8.05% on Wednesday. That was the worst single-day drop since January 5th, almost one month ago. Prices have confirmed a breakout under the May 2021 low at 2.832, bringing the commodity towards the 100% Fibonacci extension level at 2.326. The latter may hold as support.
Bouncing on support could open the door to facing the 20-day Simple Moving Average (SMA). This is maintaining the downside focus. As such, the line may hold as resistance, pivoting prices lower. Breaking under 2.326 exposes the 114.6% Fibonacci extension level at 1.555 toward 2020 lows. A lack of RSI divergence continues to show that momentum is favoring the downside from here.
{{FUNDAMENTALS BREAKOUT TRADING}}

Chart Created Using TradingView
— Written by Daniel Dubrovsky, Senior Strategist for DailyFX.com
To contact Daniel, follow him on Twitter:@ddubrovskyFX


Comments are closed.