Natural Gas Price Action Setup: Is This It?
Natural Gas, NG – Price Outlook:
- Chance of a consolidation/minor rebound in natural gas.
- While the broader slide appears stretched, the any rebound/upside could be capped for now.
- What is the outlook and what are the signposts to watch?
Recommended by Manish Jaradi
Traits of Successful Traders
The sharp rebound in natural gas in recent days is a sign that bears are getting exhausted. However, it may be premature to assume that the worst is over.
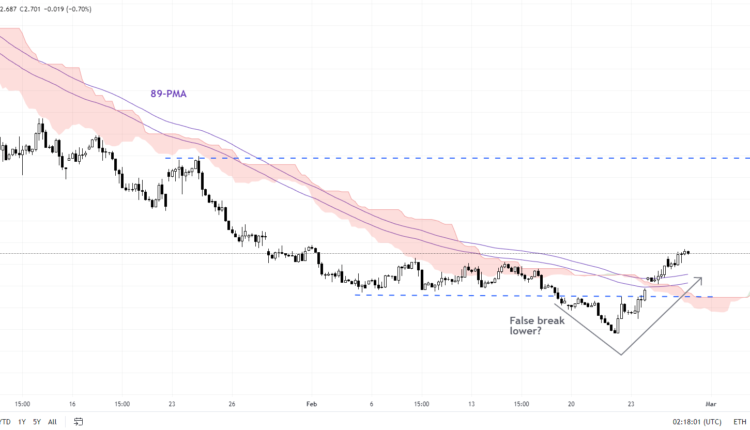
Natural gas fell to a 2.5-year low last week before rebounding 35% over four sessions, raising the prospect that the fall below immediate support at the early-February low of 2.50 was a false break. Given deeply oversold conditions on higher timeframe charts, a short-term consolidation/ minor gains may have started. For more on a big-picture perspective, see “Natural Gas Price Action Setup: Is the Slide Overdone?”, published February 21.
Natural Gas 240-minute Chart
Chart Created by Manish Jaradi using Tradingview
The quick turnaround to crack the support-turned-resistance at 2.50 confirms that the downward pressure is beginning to fade for now. Natural gas is now testing crucial resistance at the mid-February high of 2.65. A decisive break above would confirm that the immediate bearish pressure had faded. Subsequent resistance is at the late-January high of 3.60.
Natural Gas Daily Chart

Chart Created by Manish Jaradi using Tradingview
Despite how stretched the downtrend is in terms of the extent and the pace of the fall since late 2022, the jump in recent days could at best be a dead cat bounce. That is, a retest of last week’s low can’t be ruled out. That’s because the damage in recent months could take time to unwind – absent of a ‘V’-shaped rebound, it could turn out to be a prolonged base-building pattern.
However, as highlighted in the previous update, it can’t be denied that slide could be in its advanced stages, especially as natural gas last week nearly hit the strong support at the 2020 low of around 1.45, also the target of a major double-top pattern (the 2022 highs) triggered at the end of last year.
Trade Smarter – Sign up for the DailyFX Newsletter
Receive timely and compelling market commentary from the DailyFX team
Subscribe to Newsletter
— Written by Manish Jaradi, Strategist for DailyFX.com


Comments are closed.