Natural Gas Price Action Setup: Is the Slide Overdone?
Natural Gas, NG – Price Outlook:
- Natural gas prices hit a fresh multi-month low on Monday.
- On some measures, the six-month slide is beginning to look stretched.
- What is the outlook and what are the signposts to watch?
Recommended by Manish Jaradi
The Fundamentals of Trend Trading
The downward pressure on natural gas continued unabated with prices falling to a new 20-month low on Monday. Even then, there is no sign of a reversal of the downtrend. However, on some measures, the slide is beginning to look stretched.
Natural Gas Daily Chart
Chart Created by Manish Jaradi using Metastock
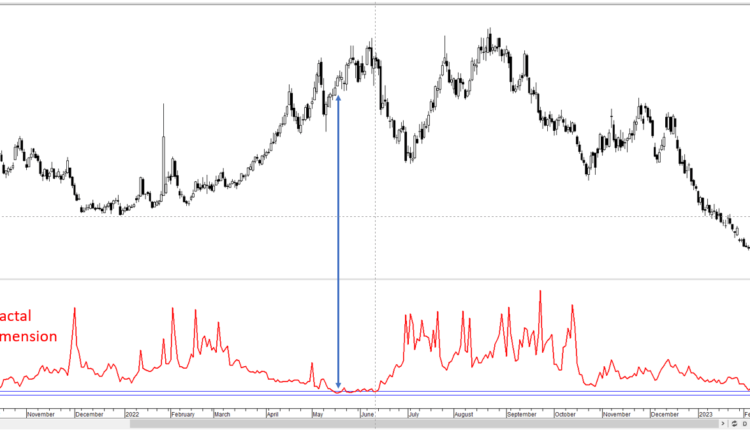
Market diversity as measured by fractal dimensions appears to be low as natural gas is at multi-month lows. Fractal dimensions measure the distribution of diversity. When the measure hits the lower bound, typically 1.25-1.30 depending on the market, it indicates extremely low diversity as market participants bet in the same direction, raising the odds of a price reversal. For natural gas, the 65-day fractal dimension is currently around 1.28, around the same level that led to a downward correction in mid-2022 (see chart).
Natural Gas Monthly Chart

Chart Created by Manish Jaradi using Tradingview
On higher timeframe charts, natural gas is looking deeply oversold. For instance, the Stochastics indicator on the monthly chart is at extreme – levels that were associated with a reveral in natural gas in the past (see monthly chart). Furthermore, the 14-week Relative Strength Index (RSI) has fallen below 30 – levels that were associated with at least a few weeks of consolidation in the past (see weekly chart).
Natural Gas Weekly Chart
Chart Created by Manish Jaradi using Tradingview
While the above measures give a sense of how stretched the slide is, they fall short of giving a sense of exact timing of a reversal. To be sure, there is no sign of an imminent reversal in natural gas. Indeed, as arecent update highlighted, a major double-top pattern (the 2022 highs) triggered at the end of last year points to further downside, potentially toward the 2020 low of around 1.45. However, the above measures do highlight that there could be limited scope for an extended weakness from here.
Natural Gas Daily Chart

Chart Created by Manish Jaradi using Tradingview
If the slide were to pause, at minimum, natural gas may need clear immediate resistance on the 10-day moving average. Since the end of December, there hasn’t been a single daily close above the average. Subsequent resistance is at last week’s high of 2.62, followed by a strong barrier at the late-January high of 3.60.
Trade Smarter – Sign up for the DailyFX Newsletter
Receive timely and compelling market commentary from the DailyFX team
Subscribe to Newsletter
— Written by Manish Jaradi, Strategist for DailyFX.com


Comments are closed.