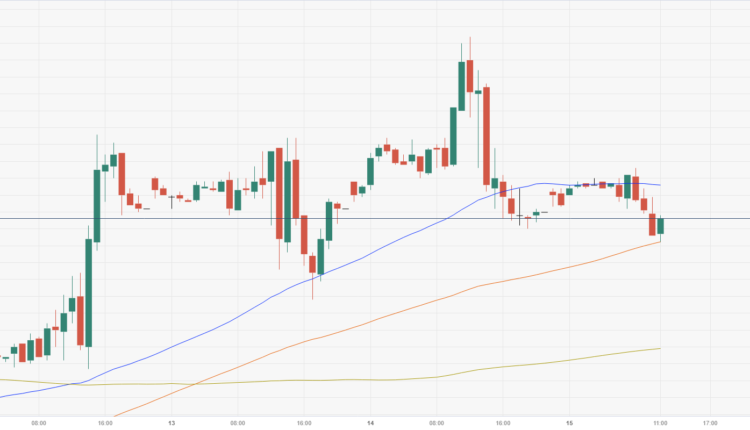
Natural Gas breaks below $3 despite supply issues increasing out of Australia
- Natural Gas dropped lower after a volatile Thursday.
- The US Dollar rallied to print a new six-month high.
- US Natural Gas prices might slide further lower after recent developments.
Natural Gas prices heads below $3, despite warnings that as of this weekend several LNG ports in Australia are going into full shutdown. The mix of headlines are pushing Natural Gas prices lower as the demand side looks to remain bleak. The latest European Central Bank meeting saw substantial downward revision in the growth projections for the eurozone, which means that the big gas-dependent block will need even less LNG than initially projected.
Add to that equation several comments out of Norway where the biggest LNG field, the Troll field, is set to fully reopen on Saturday, and already the supply is overtaking the demand. Even the United States sees its gas storage levels being filled up quite rapidly with Thursday's numbers from the Energy Information Administration(EIA) revealed a build in gas storage from 33 billion to 57 billion cubic feet. Meanwhile, Europe is ready for the winter season with still elevated temperatures in the coming weeks.
At the time of writing, Natural Gas is trading at $2.949per MMBtu.
Natural Gas news and market movers
- The European Central Bank (ECB) has slashed the growth forecast for the eurozone to the downside for the rest of 2023 and 2024. This together with the local German downgraded forecast for its growth means that the overall demand out of the block will be even lower as of 2022.
- The Norwegian Troll field is set to fully reopen on Saturday.
- The Freeport restart as well is helping to relieve any tightness in the LNG markets.
- Meteorologists are putting forward a model where temperatures will remain elevated throughout October for the eurozone.
- European gas storage is expected to survive the upcoming winter and end the season with 44% supply left. European storage is at 93%.
- A buildup in US rig counts could point to more LNG supply coming online in the coming weeks. More data on that later this Friday arrives at 17:00 GMT.
Natural Gas Technical Analysis: Icarus flight
Natural Gas took it on the chin in a direct backslash from the European Central Bank communication. The downgraded projections for economic growth in the eurozone are being translated as an even worse dampening of demand for gas. Meanwhile, European industries are seeing their order books getting thinner, and households are enjoying an Indian Summer in Europe, which means twice as less demand for LNG as normal around this period of time.
As already mentioned, $3 is the target and hard nut that needs to be cracked. Seeing the current equilibrium, a catalyst is needed to move the needle upwards. That could come with more supply disruptions from Australia or sudden changes in the current gas storage level in Europe due to a sudden peak in demand. In such events, Gas prices could rally to $3.20, testing the upper band of the ascending trend channel.
On the downside, the 200-day Simple Moving Average (SMA) at $2.89 has been turned into support. Should that give way on a downside move, some area will be crossed before the next support kicks in at $2.73. This level aligns with the 55-day SMA, which is likely to step in to avoid any nosedive moves in the commodity.
-638303738286563836.png)
XNG/USD (60min Chart)
Natural Gas FAQs
Supply and demand dynamics are a key factor influencing Natural Gas prices, and are themselves influenced by global economic growth, industrial activity, population growth, production levels, and inventories. The weather impacts Natural Gas prices because more Gas is used during cold winters and hot summers for heating and cooling. Competition from other energy sources impacts prices as consumers may switch to cheaper sources. Geopolitical events are factors as exemplified by the war in Ukraine. Government policies relating to extraction, transportation, and environmental issues also impact prices.
The main economic release influencing Natural Gas prices is the weekly inventory bulletin from the Energy Information Administration (EIA), a US government agency that produces US gas market data. The EIA Gas bulletin usually comes out on Thursday at 14:30 GMT, a day after the EIA publishes its weekly Oil bulletin. Economic data from large consumers of Natural Gas can impact supply and demand, the largest of which include China, Germany and Japan. Natural Gas is primarily priced and traded in US Dollars, thus economic releases impacting the US Dollar are also factors.
The US Dollar is the world’s reserve currency and most commodities, including Natural Gas are priced and traded on international markets in US Dollars. As such, the value of the US Dollar is a factor in the price of Natural Gas, because if the Dollar strengthens it means less Dollars are required to buy the same volume of Gas (the price falls), and vice versa if USD strengthens.


Comments are closed.