Nasdaq (NQ_F) rally corrective or start of new bullish leg? [Video]
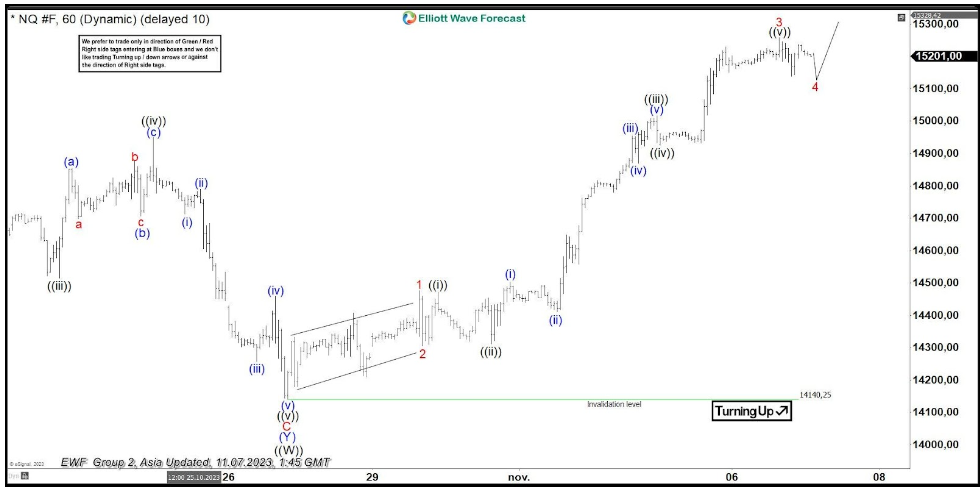
Short Term Elliott Wave in Nasdaq Futures (NQ_F) shows the Index ended wave ((W)) at 14140.25. The Index rallies to correct cycle from 7.19.2023 high in wave ((X)). Internal of wave ((X)) is unfolding as a zigzag Elliott Wave structure. Up from wave ((W)), wave (A) is in progress as a nesting impulse. Wave 1 rally ended at 14476.5 and pulback in wave 2 ended at 14306.25. Index then nested higher. Up from wave 2, wave ((i)) ended at 14472 and dips in wave ((ii)) ended at 14311.25. The Index then extended higher again in wave ((iii)) towards 15017.25.
Pullback in wave ((iv)) ended at 14925.50. Final leg higher wave ((v)) ended at 15275.5 which completed wave 3. Expect the Index to pullback in wave 4 and see support in 3, 7, 11 swing for more upside in wave 5 to end wave (A) of ((X)). Wave 4 may reach 23.6 – 38.2% Fibonacci retracement of wave 3 which comes at 14892 – 15030. Once wave 5 of (A) ends, the Index should pullback in larger degree wave (B) to correct cycle from 10.27.2023 low before it turns higher again. Near term, as far as pivot at 14140.25 low stays intact, expect dips to find support in 3, 7, or 11 swing for further upside.
Nasdaq (NQ_F) 60 Minutes Elliott Wave Chart From 11.03.2023

NQ_F Elliott Wave Video


Comments are closed.