Nasdaq 100 Pulls Off Epic Breakout, Rockets to New 2023 Highs, Defying Gravity
NASDAQ 100 TECHNICAL FORECAST:
- Nasdaq 100 breaks above major technical resistance at 13,740 and rises to its best level since April 2022
- While the technical backdrop looks constructive, the market appears stretched and close to overbought condition, signaling a near-term pullback should not be ruled out
- This article looks at NDX’s key levels to watch over the coming days
Recommended by Diego Colman
Get Your Free Equities Forecast
Most Read: Gold Prices Crushed by Resurgent Yields & Strong Dollar, Bullish Outlook in Peril
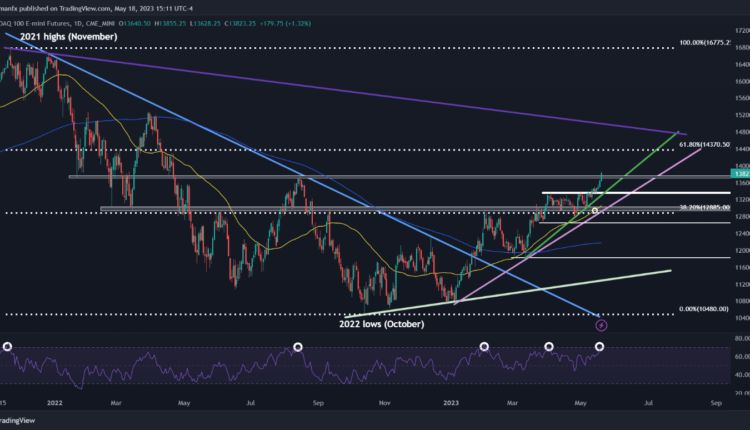
The Nasdaq 100 (NDX) extended its advance and staged another decent rally on Thursday, powering through resistance at 13,740 and notching a fresh 2023 peak in the process, signaling that buyers remain in control of the market on Wall Street, undeterred by the challenging economic landscape and looming headwinds on the horizon.
In late afternoon trading, the technology-focused benchmark was up 1.3% to 13,823, its best level since April 2022, boosted by strong performances from Nvidia and Alphabet during the session. With these gains, the Nasdaq 100 has managed to climb more than 24% since the beginning of 2023, defying gravity and the doom-and-gloom narrative.
From a price action standpoint, Nasdaq 100 remains in an uptrend although most of its year-to-date gains have been driven by megacap tech. In any case, the index has been establishing higher highs and higher lows in recent months, overtaking both the 200- and 50-day simple moving averages, two key bullish developments according to technical analysis.
Despite the constructive bias, caution is warranted as the market appears stretched and close to overbought condition, as shown by the 14-day Relative Strength Index. The last four times this oscillator reached extreme readings near or above the 70 threshold, a sell-off occurred shortly thereafter. Traders should keep this in mind going forward.
Focusing on possible scenarios, initial support rests at 13,740 in the event of a setback. If this floor is taken out, selling pressure could gather pace, setting the stage for a pullback toward 13,350. On further weakness, the focus shifts lower to the psychological 13,000 level.
On the flip side, if the recent breakout is sustained and prices stay above 13,740, bulls may become emboldened to launch an attack on 14,370 after a brief period of consolidation (this level corresponds to the 61.8% Fibonacci retracement of the 2021/2022 sell-off.
Recommended by Diego Colman
Improve your trading with IG Client Sentiment Data
NASDAQ 100 TECHNICAL CHART
Nasdaq 100 Futures Chart Prepared Using TradingView


Comments are closed.