
Introduction
MIDAS which is an acronym for Market Interpretation/Data Analysis System is the innovative work of the late technical analyst Paul Levine. Levine strongly believed that the dynamic interplay of support and resistance and accumulation and distribution are the ultimate determinants of price behavior. After examining and rejecting all of the standard technical analysis techniques for determining support and resistance, he came up with a new approach – MIDAS.
Basic Function
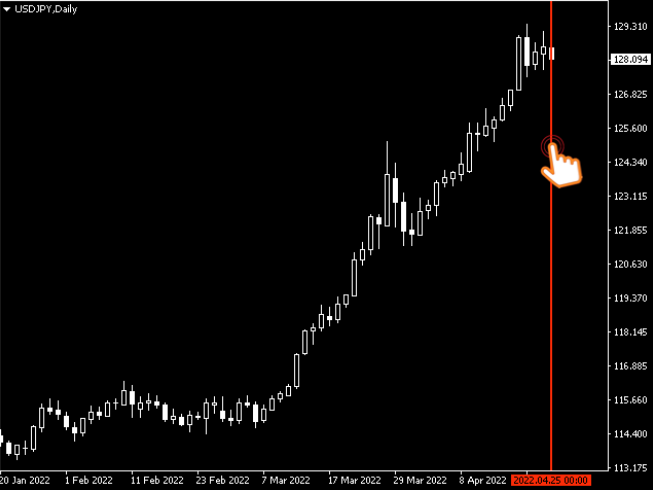
When you first attach MIDAS Trading Tools to your chart a Red vertical line will appear.
- You can drag and drop this line to choose a start date (anchor point). Double click on the line to detach it from the chart, then drag it to your selected start date.
- You can adjust the thickness and the color of the vertical line in parameters.

Chart ID
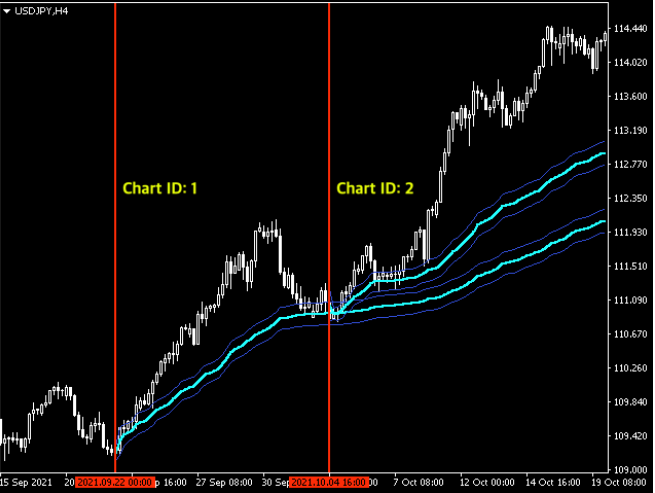
- The Chart ID feature allows you to have multiple MIDAS Curves on your chart by assigning a unique ID to each MIDAS Curve.
- Chart ID will remember where you placed each MIDAS Curve, even when you shut down the MT4 Terminal.
- If you assign two MIDAS Curves with the same ID as they will be layered on top of each other.
How to Trade MIDAS Curves
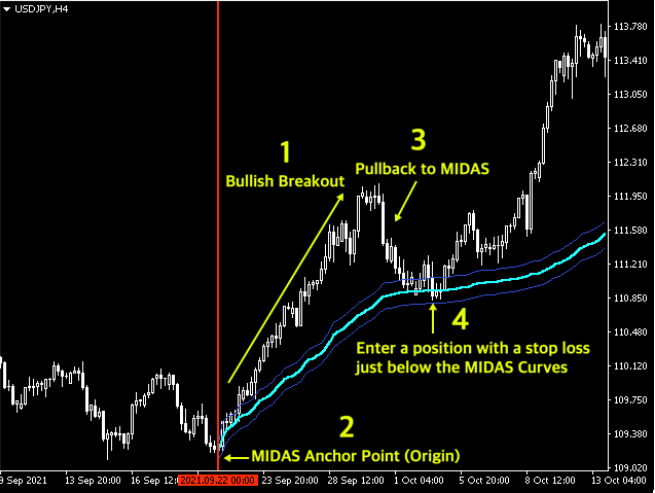
1. Identify a Trend or Fresh Breakout (V-Shape) in the market.
2. Anchor MIDAS from the origin of the trend.
3. Wait for price to pull all the way back to the MIDAS Curves.
4. When price pulls back, look for any type of odds enhancer that price will react to the MIDAS Curves.
5. Enter a position with a Stop Loss below the MIDAS Curves.
Odds Enhancer – TD Combo
I recommend using TD Combo by Thomas DeMark for enhanced market timing.
TD Combo displays exhaustion patterns and signals potential price flips and/or price exhaustions.
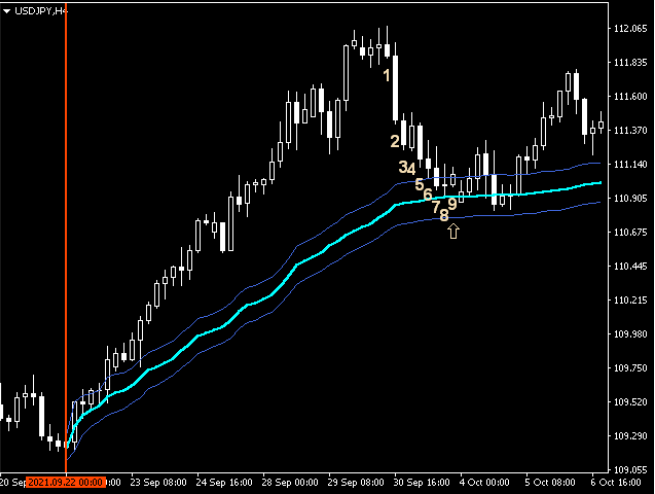
A great opportunity is spotted when price pulls back to the MIDAS Curve while simultaneously generating a TD Setup or Countdown.
In the picture below a TD Buy Setup was generated right on the MIDAS Curve.
MIDAS & FX Capital Flow Scanner
FX Capital Flow Scanner identifies the cash flow between the major currencies EUR, USD, CAD, NZD, AUD, GBP, JPY, CHF and filters out the strongest trading pairs.
1. Click on a Signal from the Scanner.
2. Anchor MIDAS to the origin of each price wave/breakout.
3. Enter a position when price pulls back to the MIDAS Curve with a Stop Loss just below.
4. Stay in the trade for as long as the scanner is showing that capital is flowing in the direction.
5. No odds enhancers needed here!
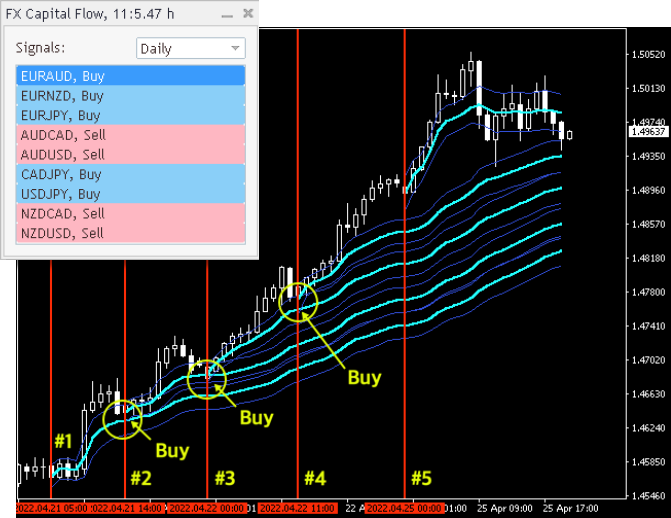
A trend will often sustain no more than 4-5 MIDAS Curves before ending.
The scanner is capable to spotting trends in their early stage so that you can get in on the pullbacks of the first 1-3 MIDAS Curves.
The Top-Bottom Finder
This is a very interesting tool for it is capable of predicting the Top or Bottom of an accelerated price move, and it can be very precise! You can think of the T-B Finder as a rocket leaving earth. If you know how much fuel a rocket have and the angle it is travelling you can predict where it will end and fall back to earth – or back to the MIDAS Curve so to speak.

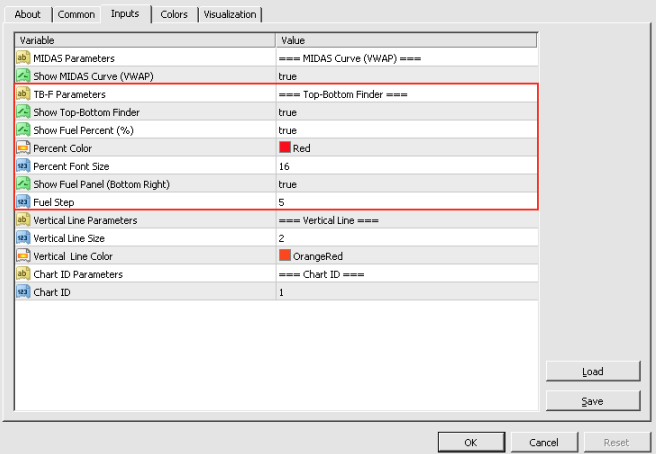
Activate Top-Bottom Finder
To activate the T-B Finder go into Parameters and set the following:
- Show T-B Finder: True
- Show Fuel Percent (%): True
- Show Fuel Panel: True
The Top-Bottom Finder should now be displayed on your chart!
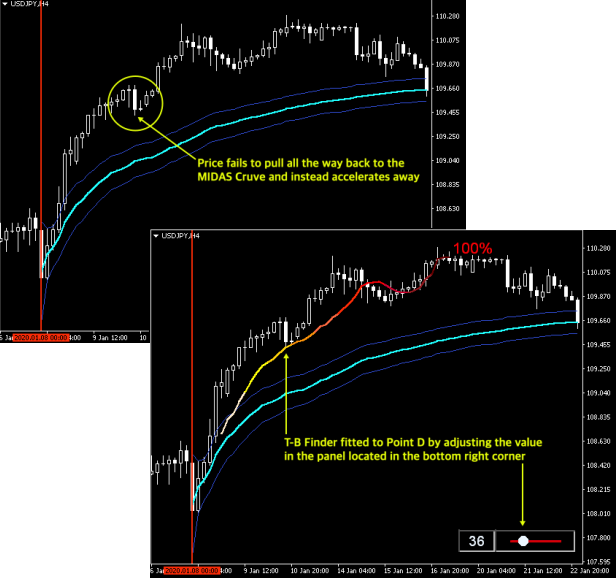
When & How to use the Top-Bottom Finder
Step 1: Identify an accelerated price move where price fails to pull all the way back to the MIDAS Curve and instead accelerates away.
Step 2: Activate the T-B Finder and fit it to Point D. Point D is the pullback that did not make it all the way back to the MIDAS Curve.
- You fit the curve by dragging the panel in the bottom right corner. You can adjust the step (5,10,15) in parameters under “Fuel Step”.
- When T-B Finder is in alignment with point D the fuel (volume) of the accelerated move have been determined.
- When adjusting T-B Finder to Point D, the fitting point has to show a minimum of 20% fuel burnt. If the fuel burnt at Point D is less than 20% there is not enough data to launch the T-B Finder.
Step 3: Identify where it ends, which is the burnout point (100% of the fuel used) and imply that where it ends will result in some form of price response, most often a pullback to the nearest MIDAS Curve.
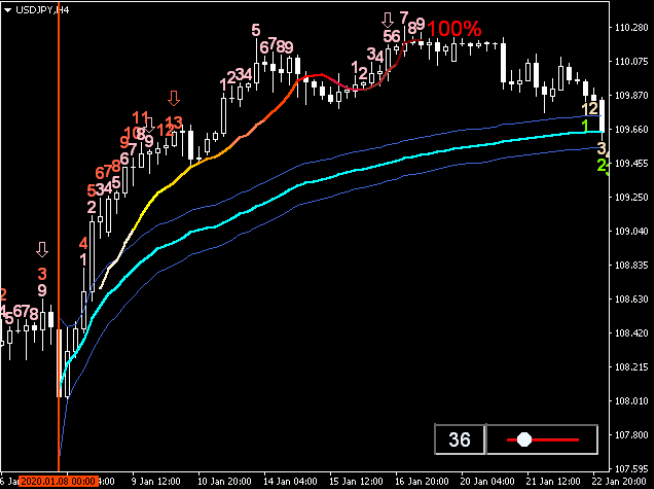
Odds Enhancer – TD Combo
A powerful signal is generated when the T-B Finders burnout point is in alignment with a TD Setup or TD Countdown.
In the picture below a TD Sell Setup was perfected just a few bars earlier to the T-B Finder (Pink Arrow).
Another TD Sell Setup was generated directly after, not perfected, however precisely on the T-B Finder.
This presented a perfect lowrisk opportunity to sell back down to the MIDAS Curve
Link: MIDAS Trading Tools
Comments are closed.