Manual for the indicator “Elliott Wave Helper” – Other – 20 October 2023
Wave analysis. Types of available patterns
- Impulse(1-2-3-4-5)
- Zigzag/Flat(A-B-C)
- triangle(A-B-C-D-E)
- Double combination(W-X-Y)
- Triple combination(W-X-Y-X-Z)
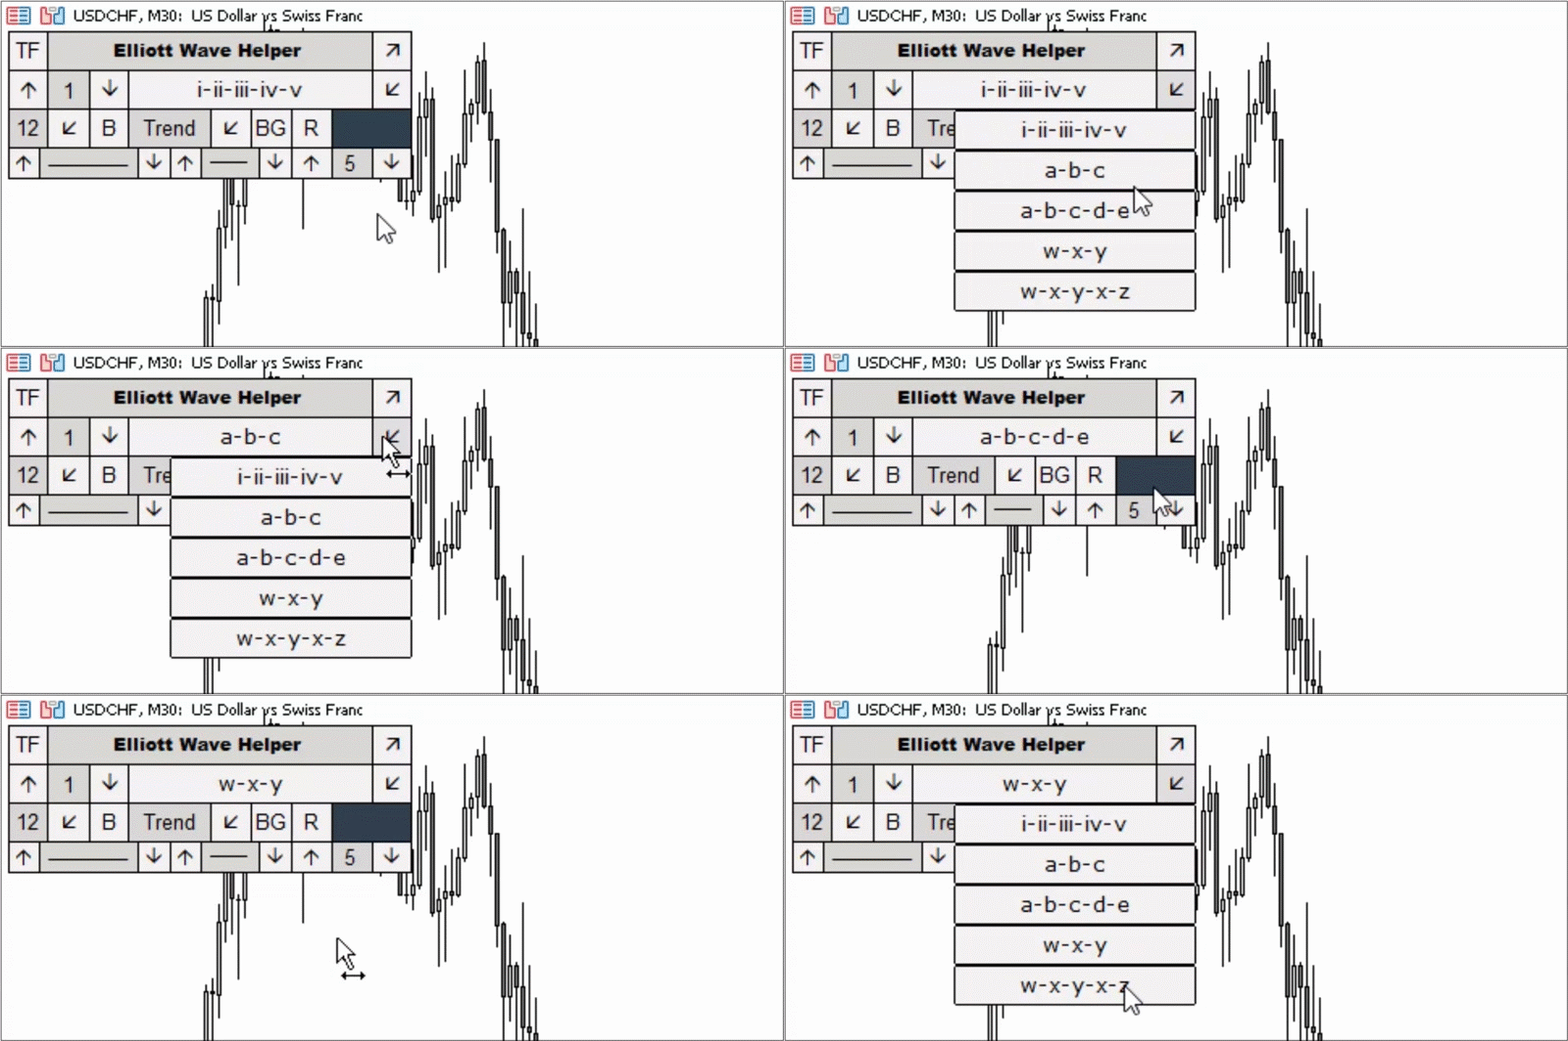
Wave analysis. Changing Pattern
This is done by clicking on the down arrow in the drop-down menu.
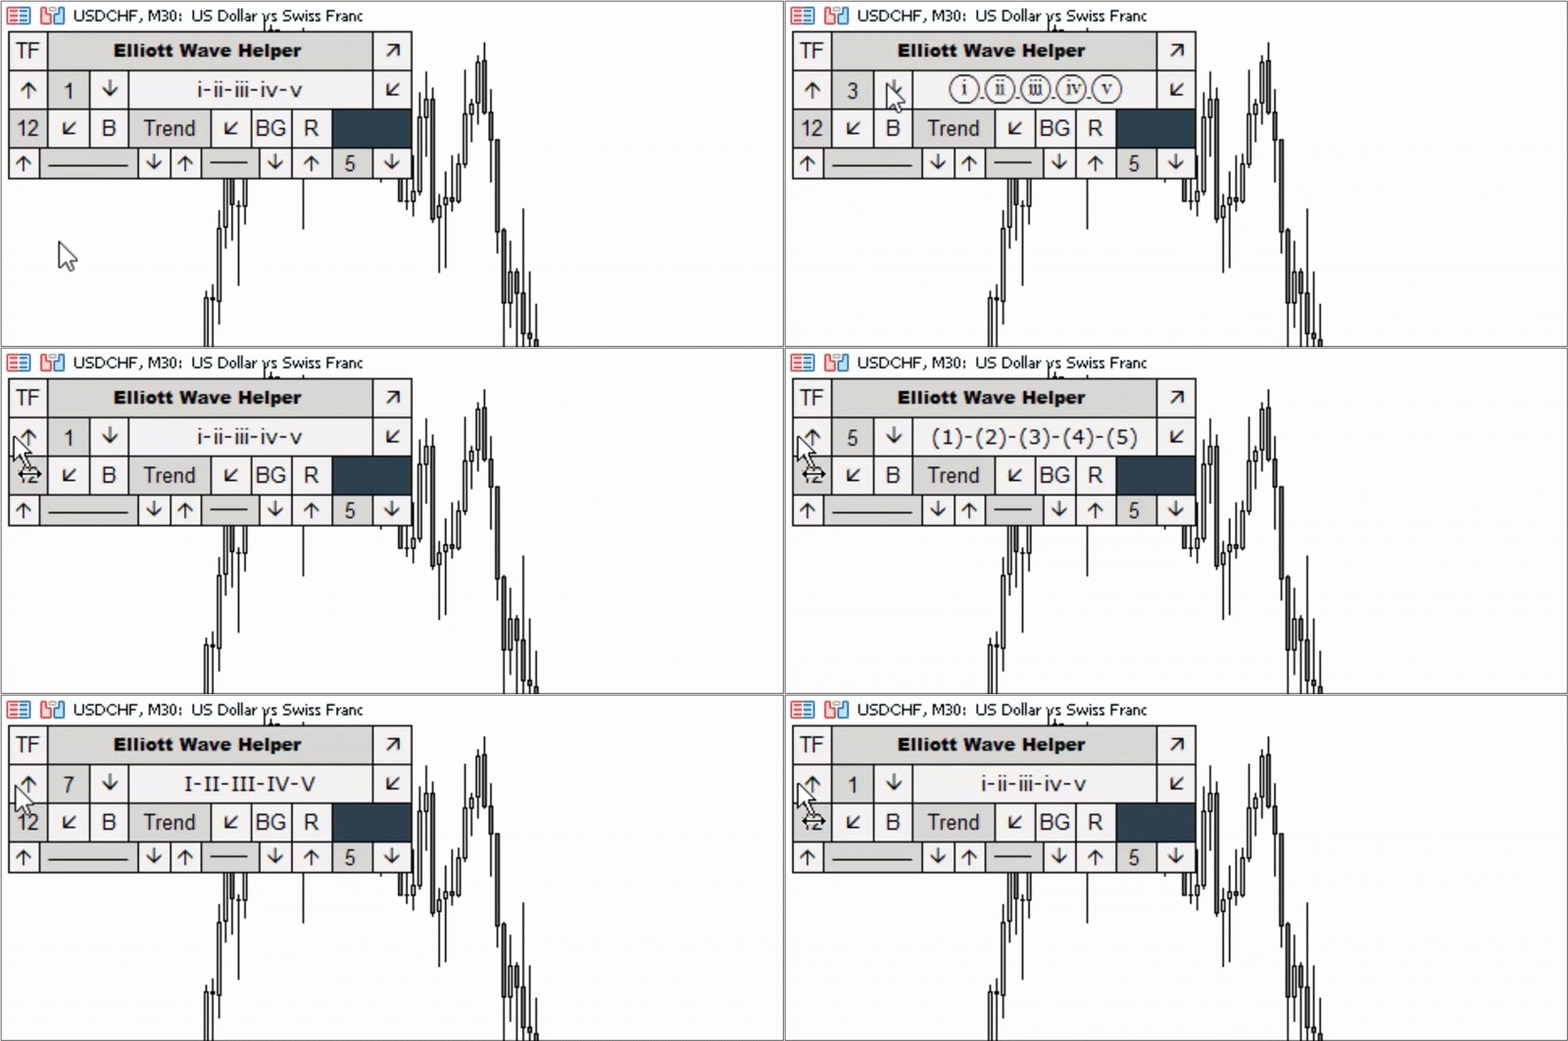
Wave analysis. Change of wave order
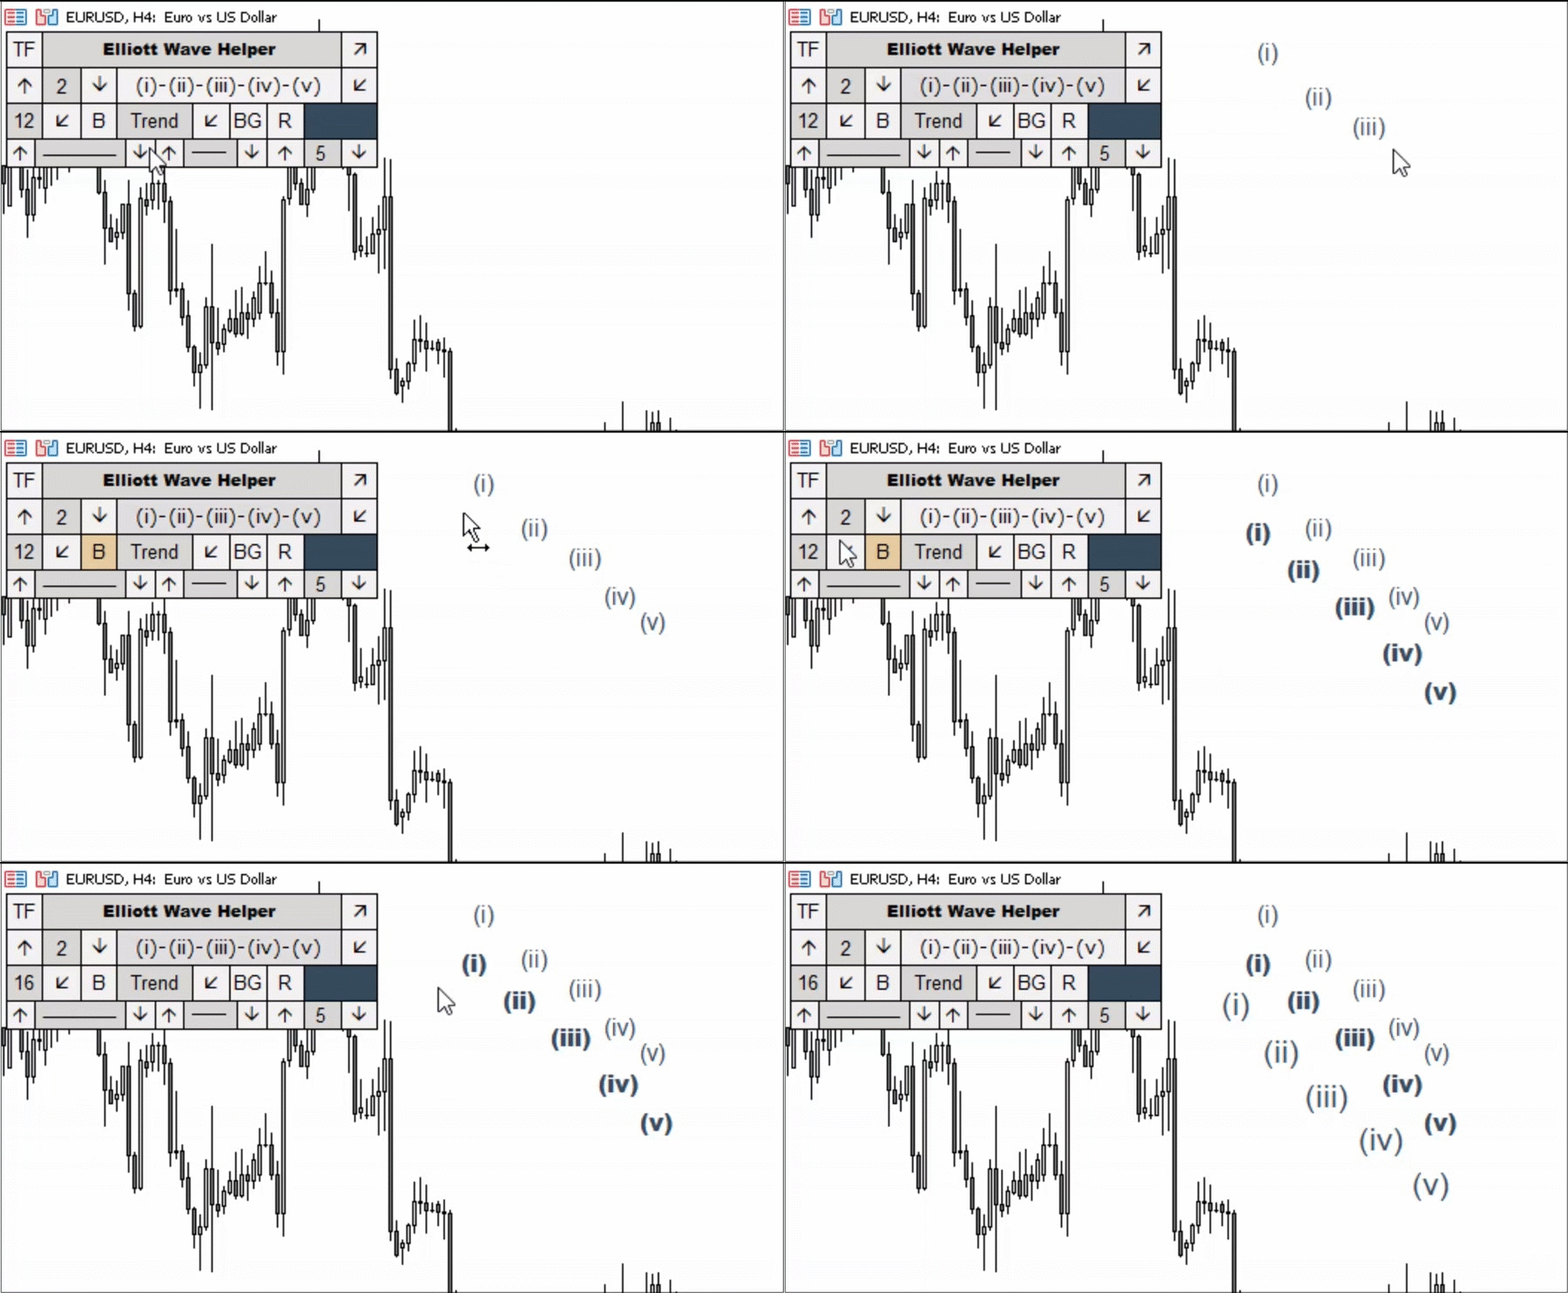
There are a total of 9 wave orders, which are responsible for the position of waves in the hierarchy and for their visual display. The down and up arrows located to the left of the pattern name are responsible for this. Between the arrows is the order number.
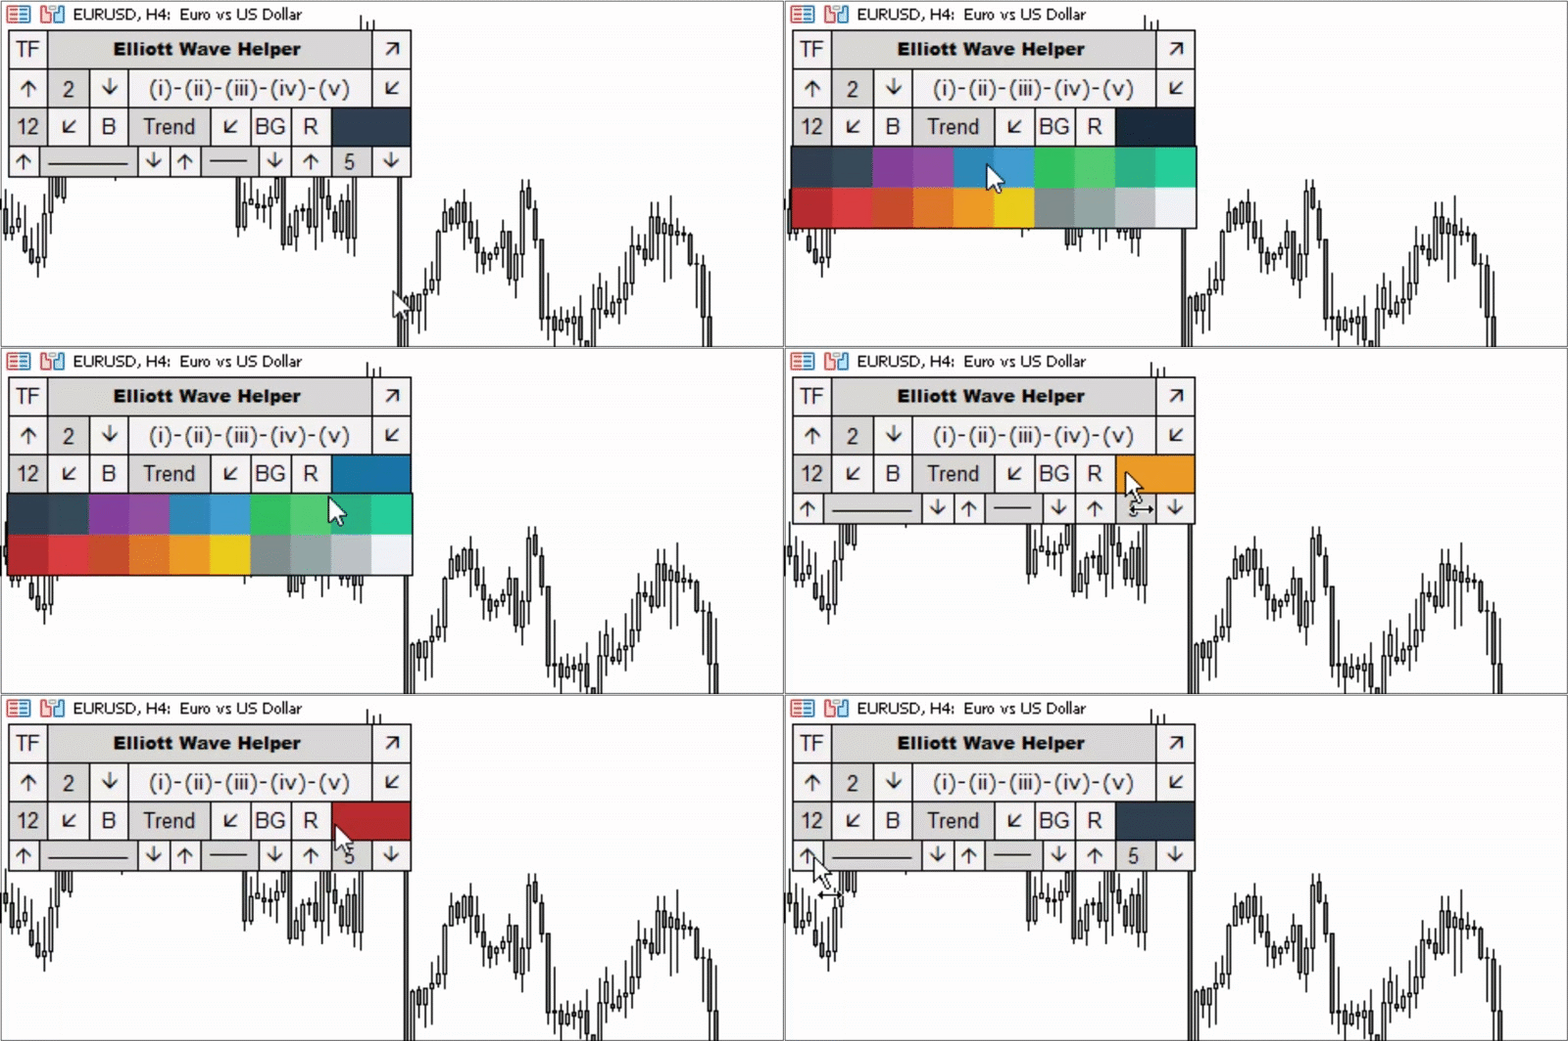
Choosing colors for patterns and lines
To select a color, click on the large rectangle and then select from the available colors. The selected color will apply not only to the letters and numbers representing wave patterns, but also to the levels and lines of technical analysis.
Making of the wave analasis
In order to build a wave pattern on the price chart, you need to click on the pattern button and activate it. After this, click the required number of times on the screen and the pattern will appear on the chart.

Wave analysis. Font
By default the panel uses font size 12. You can select it from the drop down menu. You can also make the font bold if you wish by pressing the “B” button.
Technical analysis. Types of available elements
- Segment – “Trend” button
- Trend line – “Trend” button + pressed “R” button
- Support and resistance level – “Horiz” button
- Rectangle – “Square” button. The pressed ‘BG‘ button paints the element
- Triangle – “Trianlge” button. The pressed ‘BG‘ button paints the element
In order to select one of the elements for construction, click on the drop-down menu, as shown in the picture below:
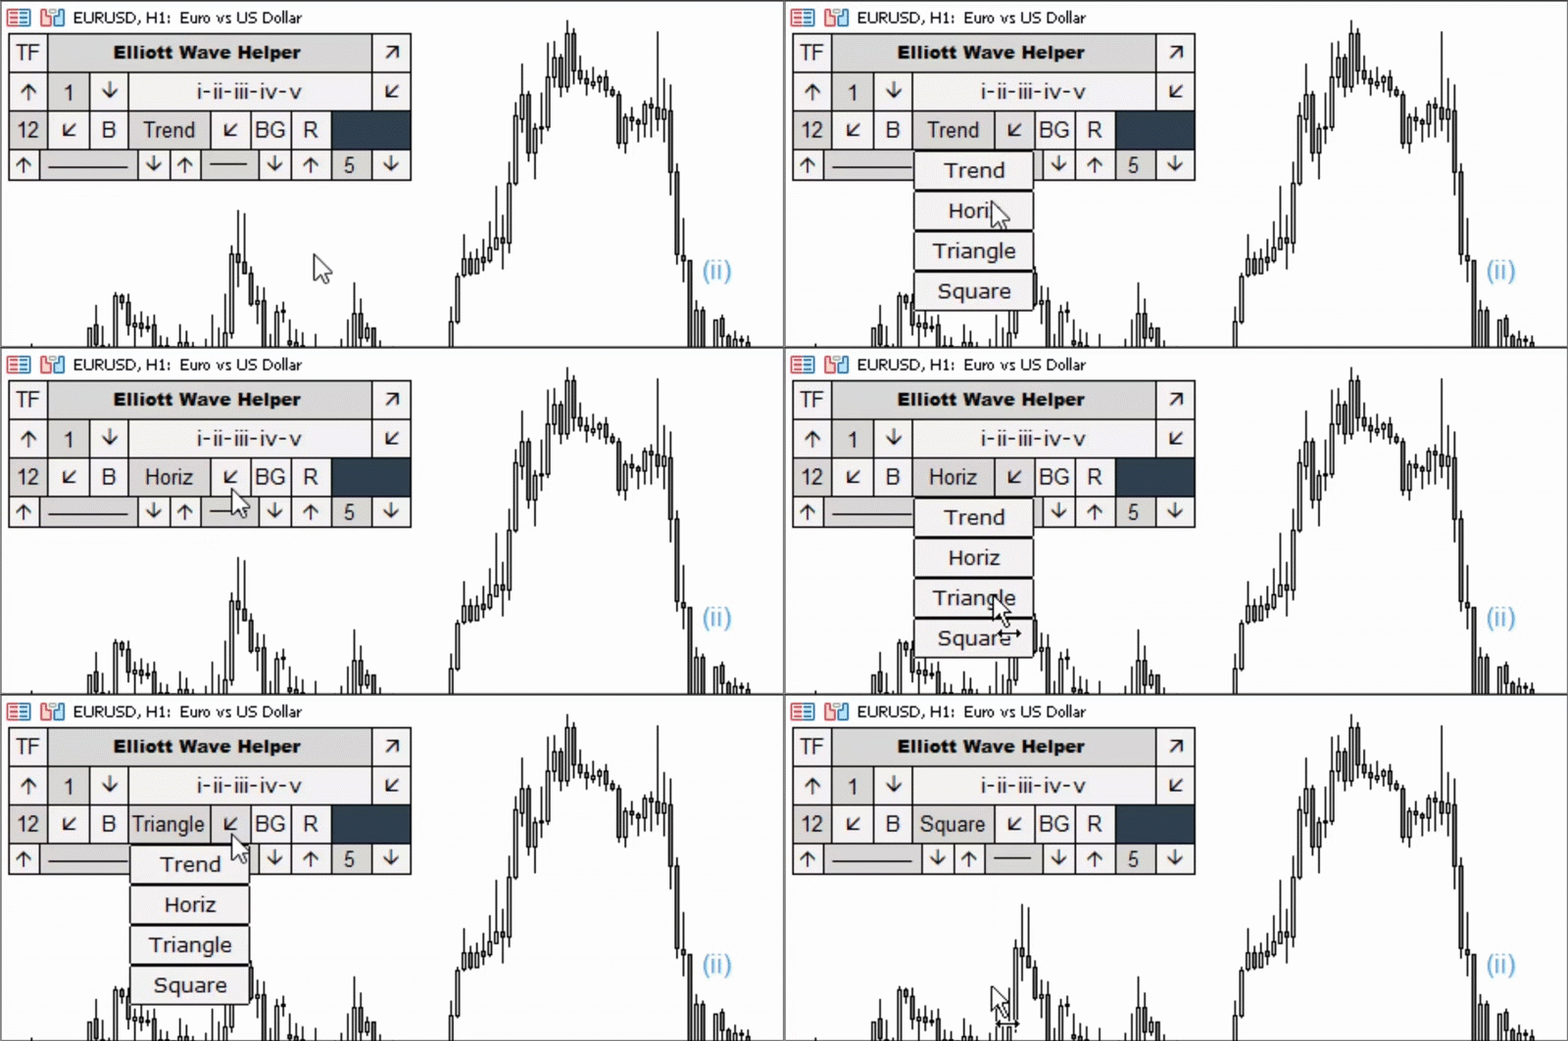
Making of the technical analysis
The making of technical analysis elements differs from the making of elliott wave analysis. In order to build a line or level, hold down the “Shift” key on your keyboard, and then click on the price chart.
- Line or segment: Hold Shift + 2 mouse clicks. 1 click – the first point, 2 clicks – the second point.
- Horizontal support or resistance level: Hold Shift + 1 click at the required level.
- Rectangle: Hold Shift + 2 clicks. 1 click is the lower left border of the rectangle, 2 clicks is the upper right border (variable).
- Triangle: Hold Shift + 3 clicks. Each click is responsible for the angle of the triangle.

Technical analysis. Line types
The logic of line type and thickness has been transferred from the trading terminal. The line on the left is responsible for the type of line, the line on the right is responsible for its thickness. Affects the segment, trend line and support or resistance level.

Background and color of rectangle and triangle
Unlike the color of letters, numbers and segments, the color of a rectangle and triangle is configured in the external parameters of the indicator. The parameters “ColorTr” (triangle) and “ColorSq” (rectangle) are responsible for this. The “BG” button is responsible for painting over the figures.

Working with timeframes
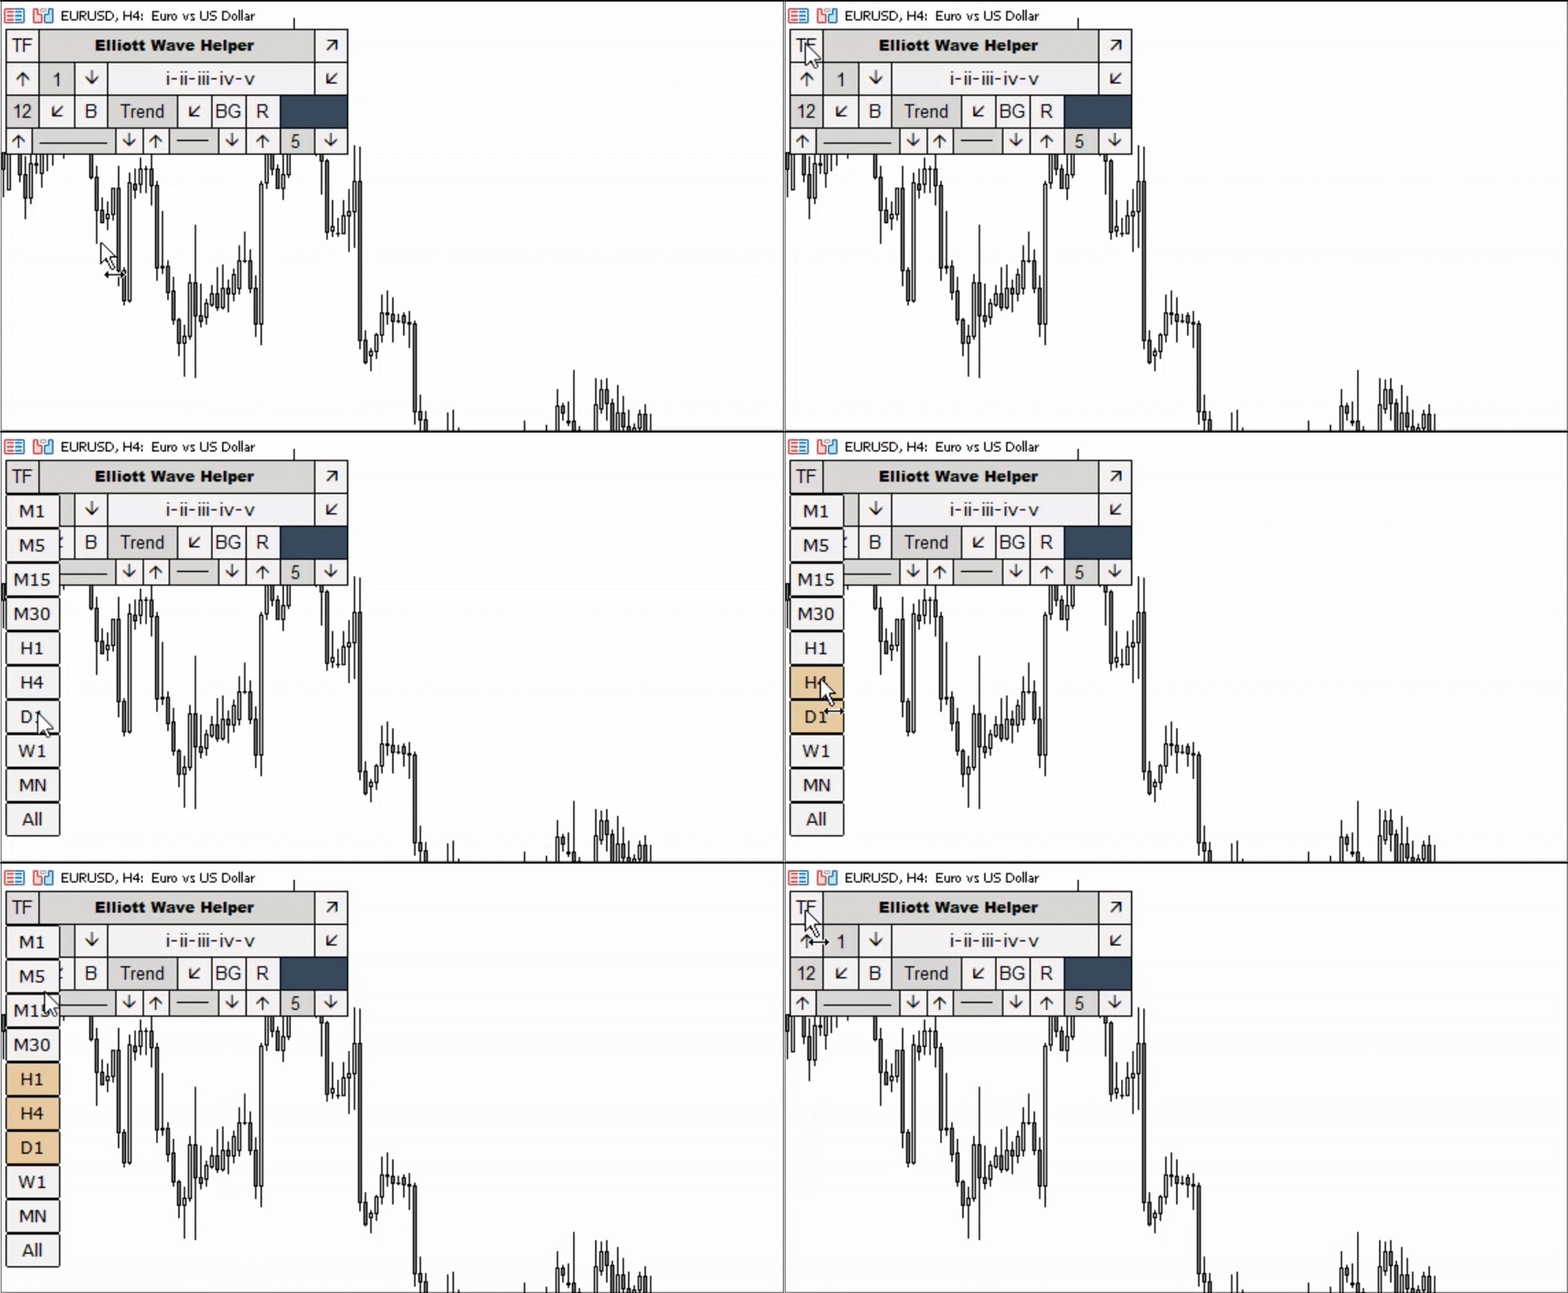
By default, all elements of technical and wave analysis are displayed only on the timeframe on which you are working. For example, if you are doing analysis on a daily chart, then all the letters, numbers and lines will also be displayed only on the daily chart.
If you want your waves and technical analysis to be displayed on multiple timeframes, then select these timeframes in the panel options before starting work. This is done by pressing the “TF” button, as indicated in the picture below:
External parameters
Author: Siarhei Vashchylka. For any questions, write to me in private messages. I also recommend subscribing to my updates. To do this, follow the link to my profile and click “Add to friends“.


Comments are closed.