Loses ground below 1.0900, further downside cannot be ruled out
- EUR/USD attracts some sellers under the 1.0900 psychological mark on Monday.
- The bullish outlook of EUR/USD looks vulnerable; RSI indicator stands below the 50.0 midline.
- The 1.0900–1.0910 zone acts as an immediate resistance level; the initial support level is seen at 1.0827.
The EUR/USD pair loses momentum during the early European session on Monday. Following surprisingly low inflation figures in main economies, traders are placing the bet that the European Central Bank (ECB) will cut the interest rate next year and begin a deeper easing cycle. The market is pricing in a 50% odds rate cut as early as March. This, in turn, exerts some selling pressure on the Euro (EUR). At press time, EUR/USD is trading around 1.0874, down 0.07% on the day.
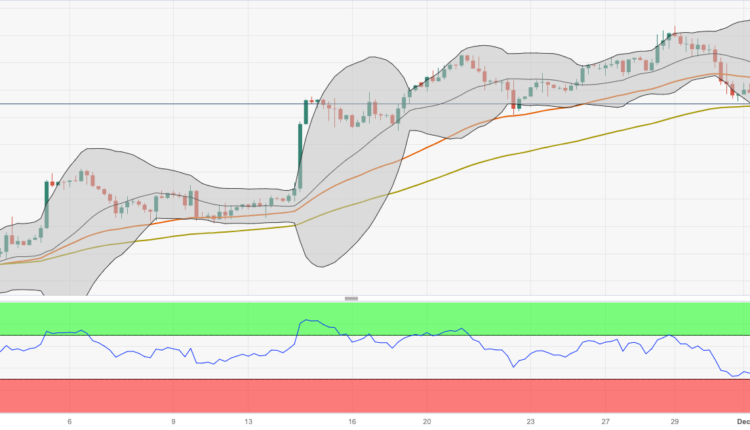
According to the four-hour chart, the bullish outlook of EUR/USD looks vulnerable as the major pair hovers around the key 100-hour Exponential Moving Averages (EMA). A decisive break below the latter will reaffirm the bearish outlook. Additionally, the Relative Strength Index (RSI) stands below the 50.0 midline, indicating that further downside cannot be ruled out for the time being.
The 1.0900–1.0910 region acts as an immediate resistance level for EUR/USD. The mentioned level is the confluence of the 50-hour EMA and a psychological figure. The next hurdle is seen at a high of November 21 at 1.0965. Any follow-through buying above the latter will see the rally to the next upside barrier near the upper boundary of the Bollinger Bang and a round mark at 1.1000.
On the flip side, the lower limit of the Bollinger Band at 1.0827 will be the initial support level. The additional downside filter to watch is a high of November 6 at 1.0755, followed by a low of November 9 at 1.0660.
EUR/USD four-hour chart


-638372690606443869.png)
Comments are closed.