Loonie Pauses on Upcoming US Drivers
USD/CAD ANLAYSIS & TALKING POINTS
- Crude oil, Israel-Palestine war and US data dynamic provide complicated backdrop for USD/CAD.
- US factors under the spotlight today.
- Key support break could see USD/CAD breakdown further.
Elevate your trading skills and gain a competitive edge. Get your hands on the U.S. dollar Q4 outlook today for exclusive insights into key market catalysts that should be on every trader's radar.
Recommended by Warren Venketas
Get Your Free USD Forecast
CANADIAN DOLLAR FUNDAMENTAL BACKDROP
The Canadian dollar braces ahead of US PPI and the FOMC minutes respectively. Yesterday’s dovish remarks by the Fed’s Logan that there may be ‘less need for the Fed to raise rates” weighed negatively on the USD despite an increased demand for the safe haven currency due to the Israel-Palestine (Hamas) conflict.
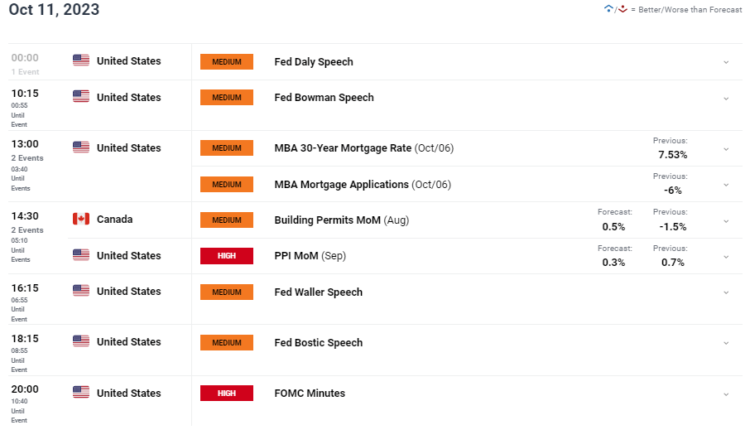
Later today (see economic calendar below) will see further Fed speakers give their addresses while US PPI could give an indication to the inflationary backdrop in the US. PPI is generally viewed as a leading indicator and if we see an upside surprise, this could suggest that CPI figures moving forward could remain elevated.
The FOMC minutes is likely to favor the hawkish narrative as the prior meeting resulted in a reinforcement of the ‘higher for longer’ narrative that could keep the greenback supported.
Crude oil prices stay buoyed on the war in the Middle East as contagion fears grip investors minds with regard to possible supply disruptions. The loonie will continue to benefit from this viewpoint should the war escalate and considering OPEC raised the demand forecast, crude oil may extend its recent rally.
From a Canadian perspective, building permit data is scheduled and with expectations hinting at 0.5% growth, USD/CAD bears could push the pair lower.
Want to stay updated with the most relevant trading information? Sign up for our bi-weekly newsletter and keep abreast of the latest market moving events!
Trade Smarter – Sign up for the DailyFX Newsletter
Receive timely and compelling market commentary from the DailyFX team
Subscribe to Newsletter
USD/CAD ECONOMIC CALENDAR (GMT +02:00)
Source: DailyFX Economic Calendar
TECHNICAL ANALYSIS
USD/CAD DAILY CHART

Chart prepared by Warren Venketas, IG
USD/CAD price action on the daily chart above highlights market hesitancy at this point with two doji candlesticks presenting themselves. The Relative Strength Index (RSI) reaffirms this with the oscillator favoring neither bullish nor bearish momentum around the midpoint 50 level. A confirmation close below 1.3575 may catalyze a move lower ahead of tomorrow’s US CPI print.
Key resistance levels:
Key support levels:
- 1.3575
- 50-day MA
- 1.3500
- 200-day MA
IG CLIENT SENTIMENT DATA: BEARISH
IGCS shows retail traders are currently net SHORT on USD/CAD, with 57% of traders currently holding short positions (as of this writing).
Curious to learn how market positioning can affect asset prices? Our sentiment guide holds the insights—download it now!
Introduction to Technical Analysis
Market Sentiment
Recommended by Warren Venketas
Contact and followWarrenon Twitter:@WVenketas


Comments are closed.