
- USD/MXN remains pressured near three-week low, stays within fortnight-old bullish chart pattern.
- Oversold RSI, mildly upbeat MACD signals suggest that Mexican Peso pair bears are running out of steam.
- Multi-month low marked in March puts a floor under the USD/MXN prices.
USD/MXN struggles to push back the bears as it seesaws around the 18.00 round figure headlines into Monday’s European session.
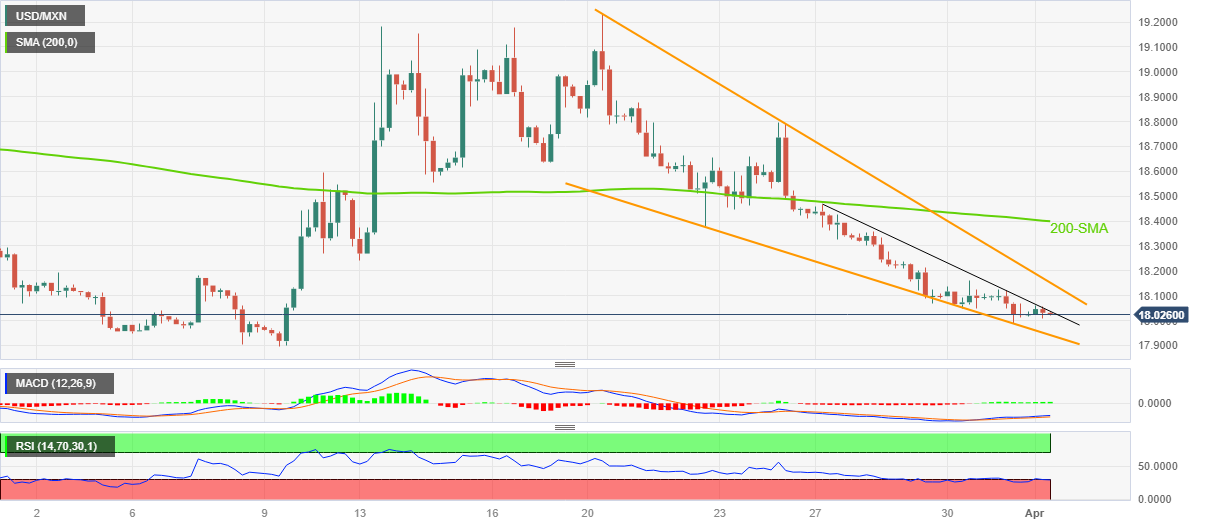
In doing so, the Mexican Peso (MXN) pair pokes a one-week-old descending resistance line while staying inside a fortnight-long falling wedge bullish chart pattern.
It’s worth noting that the overbought RSI (14) and the recently bullish MACD signals tease short-term USD/MXN buyers. However, the aforementioned resistance line, close to 18.05 by the press time, precedes the stated wedge’s top line, near 18.15 at the latest, restricting the short-term upside of the pair.
In a case where the USD/MXN pair remains firmer past 18.15, the 200-SMA level of 18.40 can act as the last check for the bulls on their way to achieving the theoretical target of the falling wedge breakout, namely around 19.40.
That said, the previous monthly high of 19.23 also acts as an extra filter towards the north.
On the other hand, the falling wedge’s lower line near 17.94 puts a floor under the USD/MXN price ahead of the previous monthly low, also the lowest level since September 2017, close to 17.89.
In a case where USD/MXN remains bearish past 17.89, the July 2017 low near 17.45 may lure the bears.
Overall, USD/MXN stays inside a bullish chart pattern but the buyers need validation from 18.15 to retake the control.
USD/MXN: Four-hour chart

Trend: Limited downside expected
Comments are closed.