Kiwi rebound eyes 0.6150 and NZ/US inflation clues
- NZD/USD defends previous recovery from the key Fibonacci retracement level, clings to mild gains of late.
- Upside oscillators favor recovery towards previous support line.
- Three-week-old falling resistance line, 200-SMA challenge Kiwi buyers.
- Kiwi sellers need validation from multi-day-old horizontal support zone, RBNZ Inflation Expectations and US CPI.
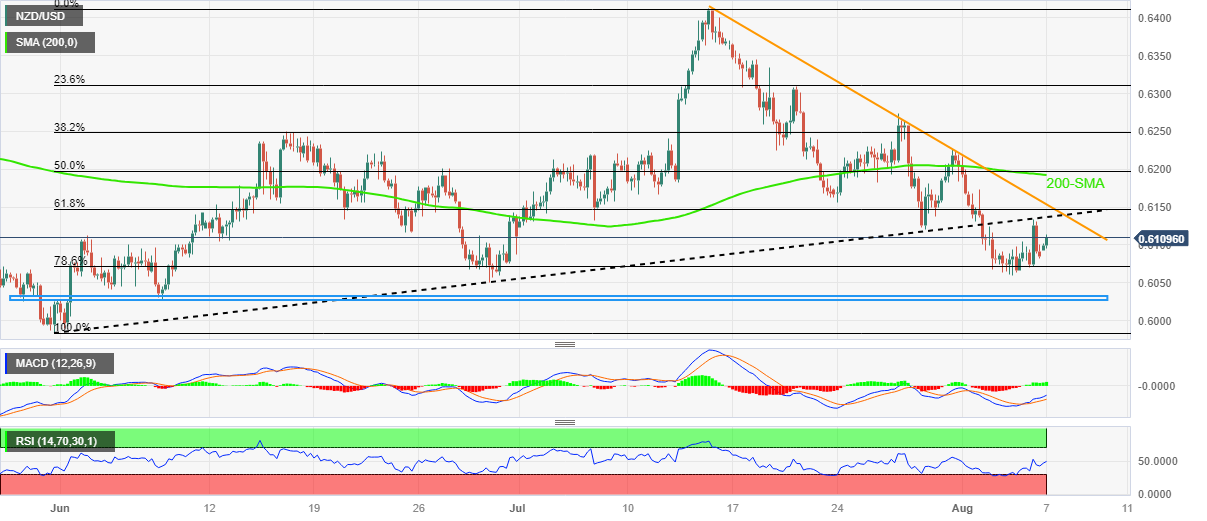
NZD/USD renews its intraday high near 0.6115 as it extends the previous run-up during the mid-Asian session on Monday. In doing so, the Kiwi pair justifies the US Dollar’s struggle ahead of this week’s US Consumer Price Index (CPI) data while also cheering the optimism ahead of the Reserve Bank of New Zealand’s Inflation Expectations for the third quarter (Q3) of 2023.
That said, the bullish MACD signals and upbeat RSI (14) line, not overbought, favor the quote’s recovery moves from the 78.6% Fibonacci retracement of the May-July upside.
With this, the NZD/USD bulls appear well-set to challenge the previous support line stretched from May 31, close to 0.6140 by the press time.
Following that, the 61.8% Fibonacci retracement and a downward-sloping resistance line from July 14, respectively ear 0.6145 and 0.6150, will challenge the Kiwi buyers before giving them control.
Even so, the 200-SMA around 0.6195 and the 0.6200 round figure will act as the final defense of the NZD/USD bears.
On the flip side, the aforementioned 78.6% Fibonacci retracement puts a floor under the NZD/USD prices near 0.6070.
In a case where the Kiwi pair breaks the 0.6070 support, a horizontal region comprising multiple levels marked since late May, around 0.6030, could test the NZD/USD bears before directing them to the 0.6000 psychological magnet and the yearly low marked in May around 0.5985.
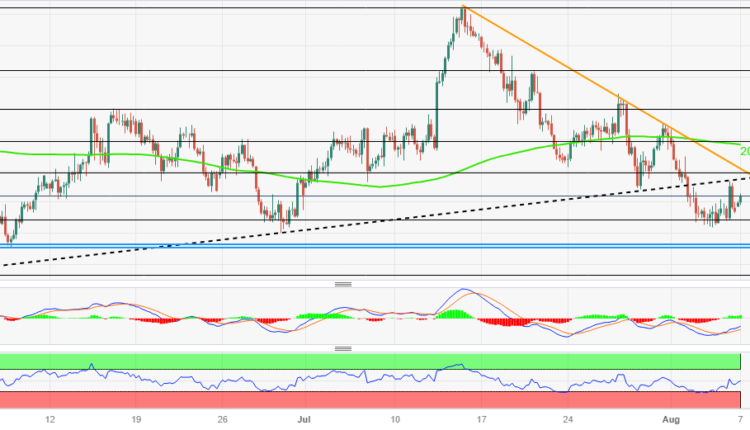
NZD/USD: Four-hour chart
Trend: Limited recovery expected


Comments are closed.