Japanese Yen Gains After Strong Demand at 2-Year Treasury Auction, Where to?
Japanese Yen, USD/JPY, 2-Year Treasury Auction, US GDP – Asia Pacific Market Open:
- Japanese Yen gained as the 2-year Treasury yield weakened
- Local bond auction showed demand was highest since 2020
- USD/JPY remains focused lower after October trendline held
Recommended by Daniel Dubrovsky
Get Your Free JPY Forecast
Asia-Pacific Market Briefing – Japanese Yen Gains as Treasury Yields Fall
The Japanese Yen gained against the US Dollar on Wednesday, capitalizing on broad weakness in the Greenback. Notwithstanding small recent changes from the Bank of Japan towards policy normalization, the BoJ remains the most dovish developed central bank. As such, the Yen often finds itself being sensitive to external developments, particularly from the United States.
USD/JPY’s drop coincided with the 2-year Treasury yield falling about 2 percent on Wednesday. The latest 2-year Treasury auction revealed that the bid-to-cover ratio jumped to 2.94 from 2.71. This is a gauge of demand. It was the highest since April 2020. It seems participants might be eager to lock in a high rate in anticipation of a future decline in yields. Such an outcome could be caused by a recession.
The auction also occurred before key US economic data comes out later today. At 13:30 GMT, the first estimate of fourth-quarter GDP will cross the wires. The US economy is seen growing 2.6% q/q, slower from 3.2% in Q3. A softer outcome could further boost beds of Federal Reserve rate cuts later this year. A subsequent drop in US bond yields would thus likely push USD/JPY lower.
Focusing on Thursday’s Asia-Pacific trading session, the economic docket is fairly quiet. As such, the focus for traders will likely be on risk appetite. Wednesday’s Wall Street trading session saw the Dow Jones, S&P 500 and Nasdaq 100 finish mostly flat. As such, this may leave markets consolidating until key US GDP data comes out later.
Japanese Yen Technical Analysis
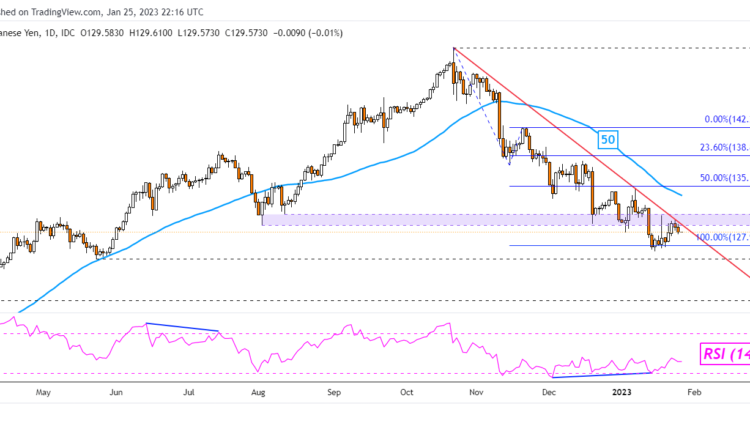
On the daily chart, USD/JPY appears to be turning lower after prices once again tested the key falling trendline from October. Further losses would place the focus on the 100% Fibonacci extension level at 127.98. Keep a close eye on RSI. Positive divergence may emerge, continuing to show that downside momentum is fading. The latter can at times carry bearish underpinnings.
Recommended by Daniel Dubrovsky
Top Trading Lessons
USD/JPY Daily Chart
Chart Created in TradingView
— Written by Daniel Dubrovsky, Senior Strategist for DailyFX.com
To contact Daniel, follow him on Twitter:@ddubrovskyFX


Comments are closed.