Japanese Yen After YCC Tweak; Has the Trend Changed in USD/JPY, AUD/JPY, EUR/JPY?
US Dollar, Australian Dollar, Euro Vs Japanese Yen – Outlook:
- USD/JPY has rebounded sharply as the market digests BOJ’s minor tweak in the yield curve control policy.
- EUR/JPY and AUD/JPY are nearing stiff resistance areas.
- What is the outlook and what are the key levels to watch in USD/JPY, EUR/JPY, and AUD/JPY?
Recommended by Manish Jaradi
Get Your Free Top Trading Opportunities Forecast
At its meeting on Friday, the BOJ maintained the band around the JGB 10-year yield of +- 0.5% with the yield target of around 0%. However, the Japanese central bank adjusted the rate at which it offers the fixed-rate purchase operations for consecutive days, from 0.5% to 1.0%, effectively signaling its willingness to allow the JGB 10-year yield to rise temporarily above the 0.5% upper bound. For more discussion see “Japanese Yen Drops as BOJ Keeps Policy Unchanged: What’s Next for USD/JPY?”, published July 28.
With BOJ committed to keep broader policy settings unhanged until it achieves 2% inflation target in a stable and sustained manner, the sharp rebound in USD/JPY suggests the YCC tweak is probably not viewed as a monetary tightening signal but managing the yield curve framework sustainably amid an environment of rising global yields.
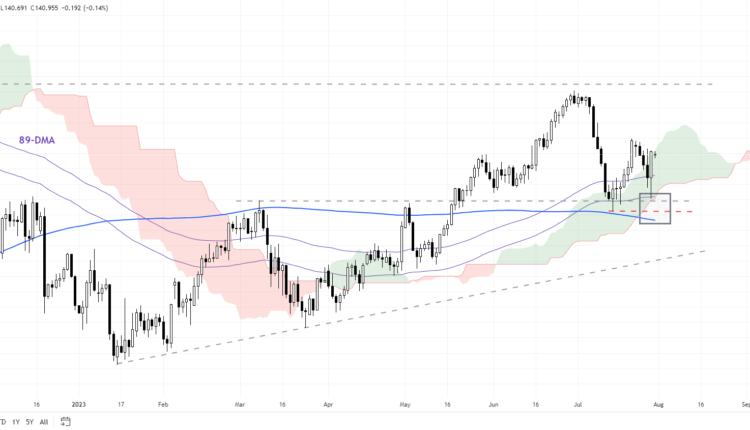
USD/JPY Daily Chart
Chart Created by Manish Jaradi Using TradingView
USD/JPY: Testing the top end of the recent range
On technical charts, USD/JPY is holding above vital converged cushion at the mid-July low of 137.25, roughly coinciding with the lower edge of the Ichimoku cloud on the daily charts. While this support remains intact, the early-July slide can be viewed as consolidation within the interim uptrend (since the start of the year) at best.
USD/JPY 240-minute Chart

Chart Created by Manish Jaradi Using TradingView
On the 4-hourly chart, USD/JPY is so far holding above a crucial barrier at 141.50-142.00, including the 200-period moving average and the July 21 high of 142.00. USD/JPY needs to clear this resistance for the seven-month-long uptrend to remain intact.
AUD/JPY 240-Minute Chart
Chart Created by Manish Jaradi Using TradingView
AUD/JPY: Rebounds from key support
The lower-top-lower-bottom sequence since late June indicates that the near-term bias for AUD/JPY is down. For the immediate downtrend to reverse, AUD/JPY needs to rise above the stiff ceiling at 95.50-96.00, including the 200-period moving average on the 4-hour chart, and the last week’s high of 96.00. Until then, the rebound from Friday looks corrective at best.
EUR/JPY 240-Minute Chart

Chart Created by Manish Jaradi Using TradingView
EUR/JPY: Watch resistance
EUR/JPY has now run into a tough barrier at 156.00-157.00, including the last week’s high of 156.25 and the upper edge of the Ichimoku cloud on the 240-minute charts. A rise above the resistance area would reaffirm the near-term trend to range, prevailing since late June.
Recommended by Manish Jaradi
Traits of Successful Traders
— Written by Manish Jaradi, Strategist for DailyFX.com
— Contact and follow Jaradi on Twitter: @JaradiManish


Comments are closed.