Imminent Pause in USD/SGD’s Slide?
SGD, Singapore dollar, USD/SGD – Technical Outlook:
- USD/SGD is oversold after weakening nearly 10% over the past four months.
- The slide could pause as the pair tests major support ahead of the FOMC rate decision.
- What are the key levels to watch?
Recommended by Manish Jaradi
Trading Forex News: The Strategy
USD/SGD TECHNICAL FORECAST – BEARISH
The Singapore dollar’s rally against the US dollar could slow or even pause as it approaches a major resistance area.
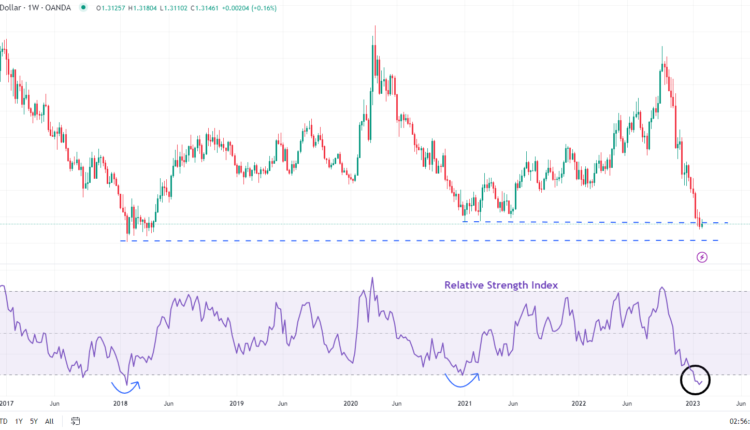
USD/SGD is deeply oversold as it tests key support on the lower edge of the channel is a horizontal trendline from 2015 (at about 1.3150), slightly above the 2018 low of 1.3000. A positive momentum divergence (lower lows in price associated with a stalling in the 14-day Relative Strength Index) suggests that the four-month slide is losing steam given the pair is down close to 10% since it made a 2.5-year high in September.
USD/SGD Weekly Chart
Chart Created Using TradingView
Some short-term consolidation/ a minor pause in the USD/SGD’s slide can’t be ruled out, especially given the US Federal Reserve interest rate decision later today. The market widely expects the Fed to hike rates by 25 basis points to 4.5%-4.75%, and the accompanying statement will be closely watched. A ‘hawkish hike’ could lead to a temporary bounce in global USD. The futures market currently expects rates to top around 4.9% on the growing conviction that US inflation could be peaking.
USD/SGD Daily Chart

Chart Created Using TradingView
A key signpost to watch would be the immediate ceiling on the 12-day moving average – the pair hasn’t breached the average decisively since the end of 2022 has been capped by the shorter moving average (see daily chart). Subsequent resistance is at the January 19 high of 1.3250. However, beyond any short-term pause, the bias for USD/SGD remains down from a multi-month perspective, ashighlighted in mid-November that the worst could be over for the Singapore dollarand apotential move toward 1.3150 in December. Any break below the converged support at 1.3000-1.3150 would trigger a breakout from the multi-year sideways channel, opening the door toward the 2011 low of 1.1985.
Recommended by Manish Jaradi
Traits of Successful Traders
— Written by Manish Jaradi, Strategist for DailyFX.com


Comments are closed.