How To Use 1 & 4 hour Chart Time-Frames to Confirm Daily Chart Signals » Learn To Trade The Market
 A common question beginning traders ask me is whether or not I use intraday or “lower time frame charts” and if so, how do I use them?
For the most part, the answer is yes, I do use intraday charts. However, (you knew there was going to be a however, right?) there is a time and place for everything, especially intraday charts. It’s important you understand when to use them and how to use them. This is something I go into much greater detail on in my advanced price action trading course, but for today’s lesson, I wanted to give you a brief overview of just how I incorporate intraday charts into my daily trading routine.
This tutorial will demonstrate several of the core ways I use intraday chart time frames to provide additional confirmation to daily chart signals as well as manage risk, manage position size and improve the risk reward of a trade.
My favorite intraday chart time frames to trade…
Typically, people who email me about the intraday time frames want to know if I ever trade solely off of these lower time frames. The answer is, yes, I sometimes do trade the 1-hour or 4-hour charts on their own without taking into account the daily or weekly time frame. However, 90% of the time I use the 1-hour and 4-hour charts to confirm the higher time frame signal, mainly the daily chart time frame.
In this way, the intraday charts work as an extra point of confluence to give weight to a trade and further confirm whether or not I want to enter it. The other big advantage of the intraday charts is that they can allow me to fine-tune my entry to achieve better risk management. More on these topics later.
- The most important thing to remember is that I never go lower than the 1-hour chart because from my experience, any time frame under the 1-hour is just noise. As you go lower in time frame, there are increasing amounts of meaningless price bars that you have to sift through and this makes the story of the market cloudier and cloudier, until you reach a 1-minute chart where you are basically just trying to make sense of gibberish.
- I only look at the 1-hour and 4-hour charts when I am looking at intraday time frames. The anchor chart that I base most of my trading decisions on is always the daily chart time frame.
- For those who like to look at weekly charts, the concepts in this lesson could be applied there as well. You would essentially use the daily charts to confirm weekly signals and add confluence to them, as well as fine-tune your risk management. It should be noted, I rarely trade off weekly charts alone, but for the die-hard weekly-chart traders, keep this in mind when reading the rest of this tutorial.
- Remember, it is NOT essential to trade the daily chart with confirmation from the intraday. It’s just something you might want to implement as you become more advanced and have mastered the basics of trading daily chart time frames.
- Remember, this is NOT day trading! The length of time we are holding these trades is still intended to be a full overnight position or multiple days / weeks. Remember, the initial trade trigger is still the higher time frame chart.
Using Intraday Charts for Second Chance Trade Entries
Everyone hates missing out on a perfectly good trade, myself included. Luckily, there are a number of different ways you can get a good second chance trade entry on a signal you initially missed.
One of those ways is by use of the 1-hour or 4-hour charts to look for a signal a few hours or even days later, to re-enter in the direction of the original daily chart signal that you missed.
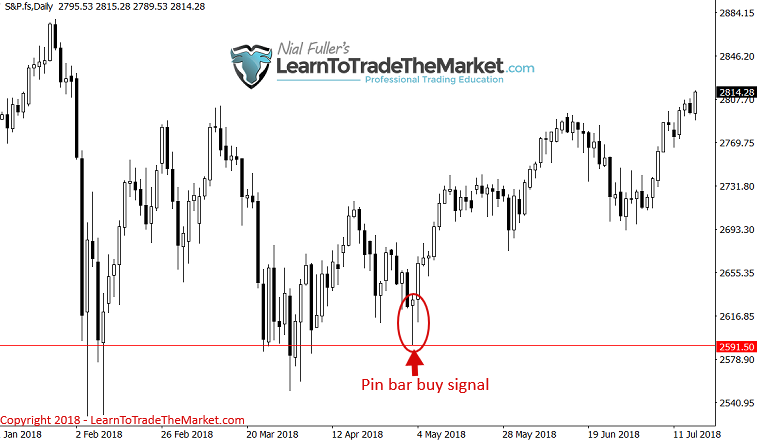
In the example below, we see a clear-as-day pin bar buy signal from support in the S&P500, circled in the chart below. If you missed this one, you were definitely kicking yourself…
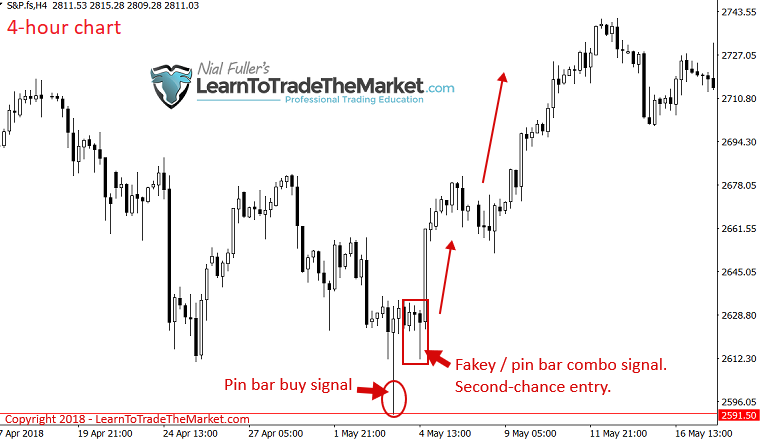
However, for savvy price action traders, they know a second-chance entry will often present itself on the intraday charts not long after the daily signal fires off. Notice, in the chart below, we see a fakey pin bar combo pattern formed shortly after the daily pin bar. Also, notice there was a larger 4-hour pin bar that formed the same day as the daily signal, adding more confluence to that daily signal.
Using Intraday Charts to Confirm Daily Signals
Sometimes, you may see a potential daily chart signal but you don’t feel convinced. It may not “look right” to you and you feel it needs some more confirmation as a result. This is normal, and it happens often.
You will sometimes then get a 1-hour or 4-hour chart showing a super-convincing signal after the daily one you weren’t sure about.
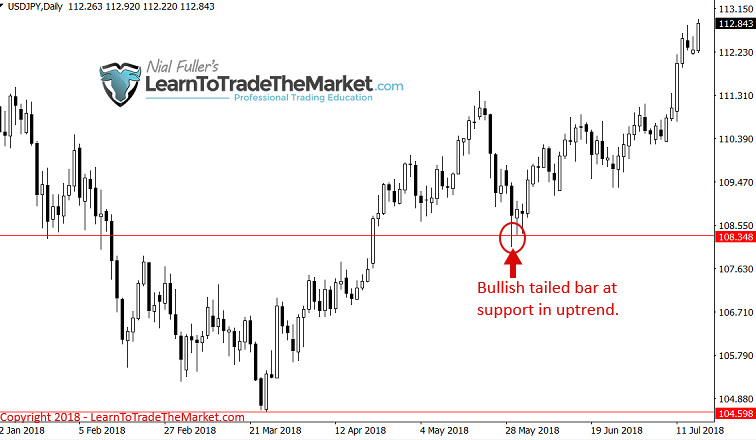
Notice, in the chart below, we had a bullish tailed bar at support in an up-trending market. But at the time that bar formed, you would probably be wondering if it was really worth taking or not, due to its bearish close and the preceding swing lower.
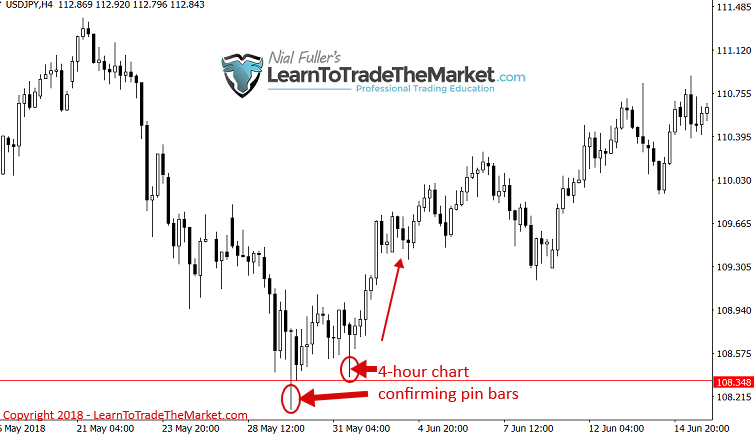
Intraday chart to the rescue. Notice the two convincing 4-hour pin bars that formed around the time of the above daily chart bullish tailed bar. You could have used these 4-hour pins to further confirm your feeling about the daily chart signal you weren’t sure about.
Sometimes, you will see a daily chart signal forms but does not have any real obvious confluence with a strong trend or key chart level. In these cases, you can rely on a clean intraday signal to be the confluence that you need to either enter the trade or pass on it.
Notice in the daily S&P500 chart below, there was an intense sell off in early 2018. It would have been very tough for most traders to buy right after such a strong sell-off. There was a lot of bearish momentum and pressure overhead and this would have cast doubt on the daily chart pin bar signals seen below.
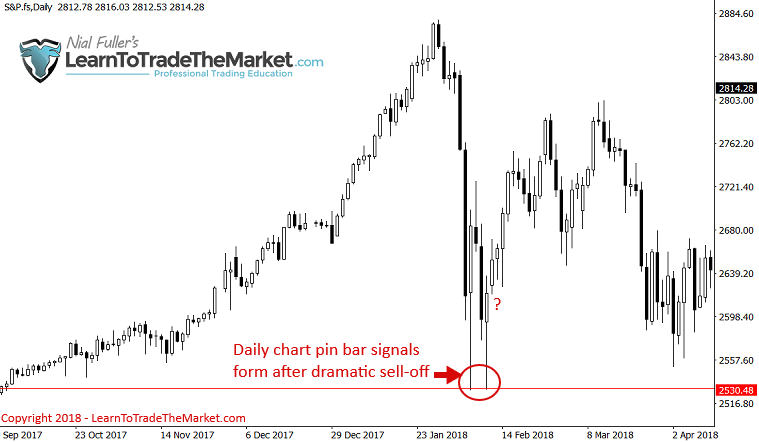
The 1-hour chart would have helped us in this situation. As seen below, back-to-back 1-hour chart pin bars formed at the time of the above daily signals, indicating further confluence and giving us further confirmation, it was safe to enter long. Also, entering on these 1-hour pin bars allowed a much tighter stop loss and thus better risk / reward profile as will be discussed in the next section.
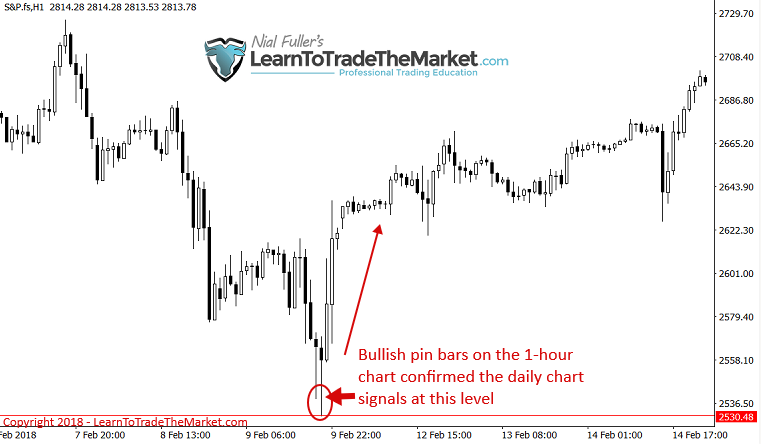
Using Intraday Charts to Tweak Your Risk Reward and Position Size
As we know, the daily chart requires us to use wider stops most of the time (unless we use the 50% tweak entry as exception), so in most cases, when we use the 1 or 4-hour intraday chart, we can implement a tighter stop loss and adjust position size accordingly. This allows us to substantially improve our risk reward because the stop loss distance is reduced and the position size can be increased as a result, but the profit target remains the same.
This is not going to be the case on every trade on intraday charts, sometimes the risk management ends up being very similar to what it would have been on the daily chart on its own. But there are many instances where it works out to where you can double or triple the potential reward on a trade by utilizing intraday signals.
In the Dow Jones daily chart example below, we can see a clear pin bar signal formed and if you had entered near the pin high with the classic stop placement of the pin low, you’d likely get a 2R reward, POSSIBLY 2.5 or 3R at the most.
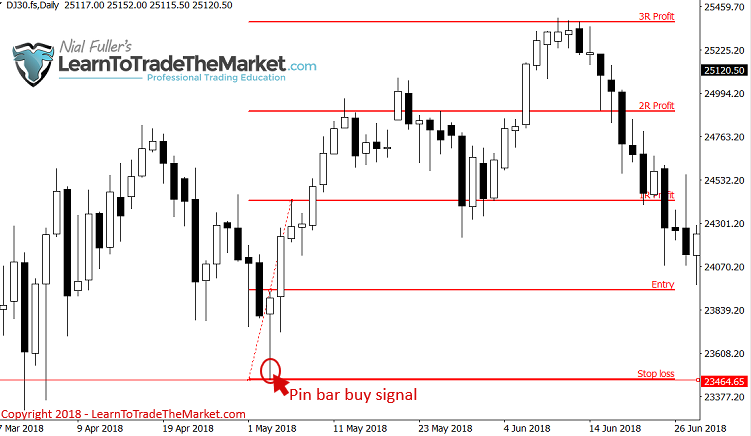
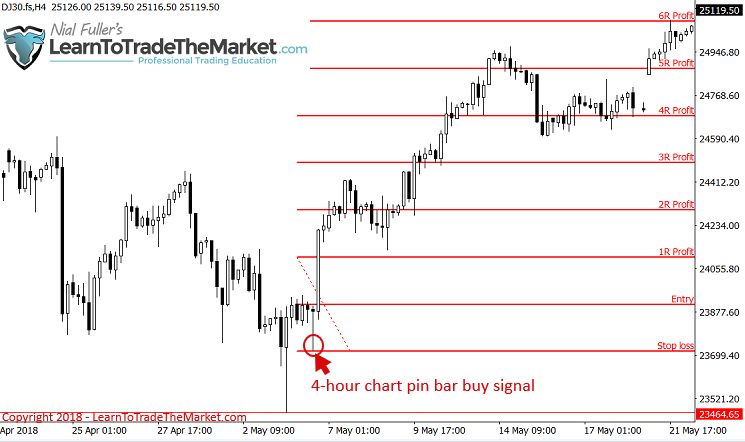
The 4-hour Dow Jones chart around this same time, fired off a 4-hour pin bar shortly after the daily pin above, providing us the potential to essential trade that pin bar instead, this reduces the stop loss by about half and allows us to double the position size, upping the reward to 6R max instead of 3R. Maximizing winning trades is essentially how you build a small account into a big one and how you make big money in the markets.
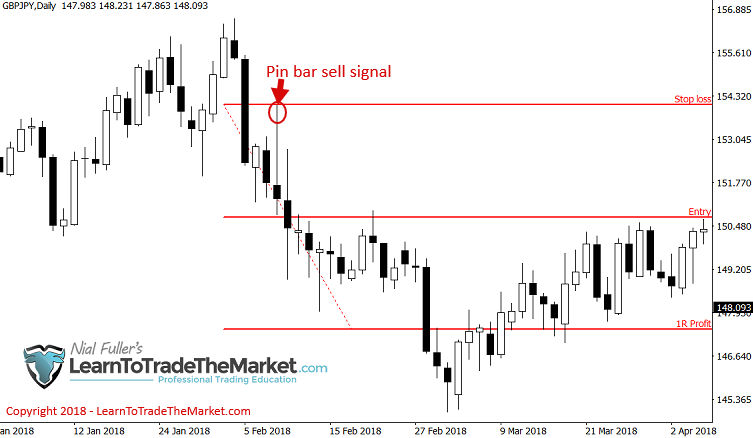
A similar situation in the example below. A nice GBPJPY bearish daily pin bar formed, albeit a pretty wide one. Your stop loss would have been over 300 pips from pin high to low on this one, greatly limiting the potential Risk Reward:
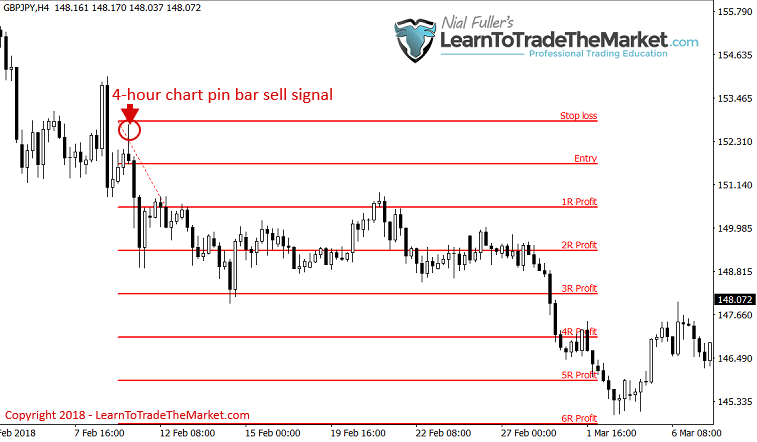
The 4-hour chart fired off a much smaller pin bar after the above daily pin. This allowed us to turn a 1R winner into a 5R or more potential.
Conclusion
The intraday tweaks and ‘tricks’ that I showed you in today’s lesson are just some of the ways I utilize the 1-hour and 4-hour charts with my three core price action trading strategies in my trading plan.
Price action trading does not simply consist of just looking for a few candle patterns on a chart and then placing a trade, not even close. There is a lot more involved. The process of actually finding and filtering trades, managing risk / reward and then executing the trade and managing it both technically and mentally, is something you can’t learn overnight. There is a technical analysis side and a mental side to every trade, and both parts have to be learned and practiced over and over before you truly gain the ability to make consistent money in the market.
After reading today’s lesson, I hope you have a better understanding of how to use the intraday charts properly, unlike most traders. Don’t make the mistake of using the intraday charts to micro-manage your position and over-trade. This is wrong and will cause you to lose money.
Instead, utilize the tips and tricks learned in this lesson and the others I teach in my trading course, to use the intraday charts to your advantage. Trading is about making the most out of a good signal, and this is what I use the intraday charts for, not to over-trade or meddle in my trades like most traders do. I hope you too can now use the intraday charts to your advantage by implementing the theory and concepts in this tutorial to ultimately improve the odds of any given trade working out in your favor and maximize its profit.
What did you think of this lesson? Please leave your comments & feedback below!


Comments are closed.