Hovers near 83.20 lined up with key barrier at 21-day SMA
- USD/INR snaps the three-day losing streak.
- 21-day SMA at 83.22 acts as the immediate barrier.
- MACD indicator suggests a bearish trend in the market sentiment.
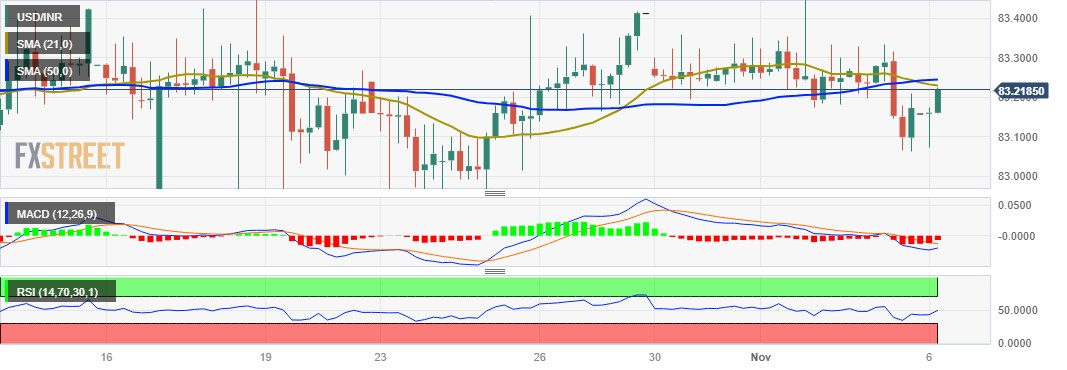
USD/INR trades higher around 83.20 lined up with immediate resistance near the 21-day Simple Moving Average (SMA) at 83.22. The USD/INR pair could gain more profits in the short term as the 50-day SMA lies slightly above the latter at 83.24.
The USD/INR pair bounces back from the recent losses incurred in the previous session, particularly after the release of disappointing US Non-Farm Payrolls data on Friday. The US Bureau of Labor Statistics revealed the October data, indicating a count of 150K, falling short of the anticipated 180K and marking a significant decline from September's 297K.
On the downside, the USD/INR pair could find key support at 83.00 psychological level aligned with October’s low at 82.97.
The Moving Average Convergence Divergence (MACD) line lies below the centerline and shows convergence occurring below the signal line. This configuration typically suggests a bearish trend, indicating potential downward momentum in the USD/INR pair.
The 14-day Relative Strength Index (RSI) hovering around the 50 level indicates that there is no strong bias towards either overbought or oversold conditions, and the market is in a state of equilibrium.
USD/INR: Four-Hour Chart


Comments are closed.