Hovers near 50-day EMA; bullish signals emerging amid mixed bias
- NZD/USD is trading at 0.6154, showing minimal gains of 0.11%.
- Key support levels are April 26 low at 0.6111, the June 8 low of 0.6032, and the year-to-date (YTD) low at 0.5985.
- Bullish signs are apparent in oscillators, yet they suggest a mixed bias due to a slightly above-midline RSI and falling three-day RoC.
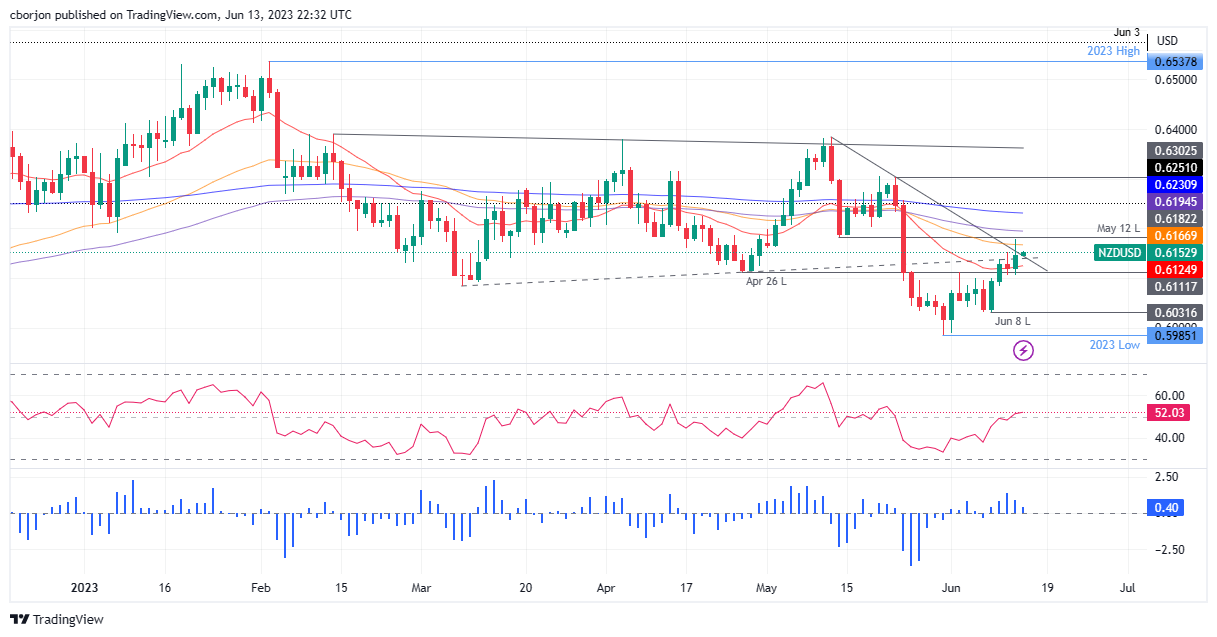
NZD/USD is still consolidated despite breaching previous resistance at the 20-day Exponential Moving Average (EMA) at 0.6125. However, failure to clear the 50-day EMA at 0.6167, the NZD/USD pair trimmed some of its gains, registering a gain of 0.43%. As the Asian session commences, the NZD/USD trades at 0.6154, reporting minimal gains of 0.11%.
NZD/USD Price Analysis: Technical outlook
The NZD/USD is neutral to a downward bias, albeit breaking a downslope resistance trendline that intersects with the 50-day EMA. For the NZD/USD to shift the bias to neutral, buyers must reclaim the May 12 swing low-turned resistance at 0.6182 before the NZD/USD could challenge the 0.62 handle. On the other hand, to resume its bearish bias, the NZD/USD needs to drop below the 20-day EMA at 0.6124 for the pair to extend its losses.
In the outcome of the latter scenario, the next support would be April 26, low at 0.6111. A break below that area and the NZD/USD would surpass the next support at 0.6100 as the pair continues to test the June 8 low of 0.6032. Once cleared, the year-to-date (YTD) low would be up for grabs at 0.5985.
From an oscillator point of view, bullish signals are emerging but are still in the early stages of a shift to a neutral bias. The Relative Strength Index (RSI) is slightly above 50-midline; while the three-day Rate of Change (RoC) portrays buyers are losing momentum. Hence, the bias is mixed.
NZD/USD Price Action – Daily chart


Comments are closed.