

Hang Seng Index, Hong Kong Equities, HSI – Technical Outlook:
- Upward momentum in the Hang Seng Index is strengthening.
- Rising odds that the worst could be over for HK/China stocks.
- What are the key levels to watch?
Recommended by Manish Jaradi
Get Your Free Equities Forecast
HANG SENG INDEX TECHNICAL OUTLOOK – BULLISH
Higher highs registered on the weekly charts suggests that the Hang Seng Index’s trend remains up on optimism related to China’s economic reopening.
The Hang Seng Index (HSI) rose to a new six-month high last week (Hong Kong markets reopen on Thursday after the Lunar New Year holidays). This coupled with still-strong upward momentum on the daily charts (the 14-day Relative Strength Index is above 75) confirms that the short-term trend is bullish.
Hang Seng Index Daily Chart
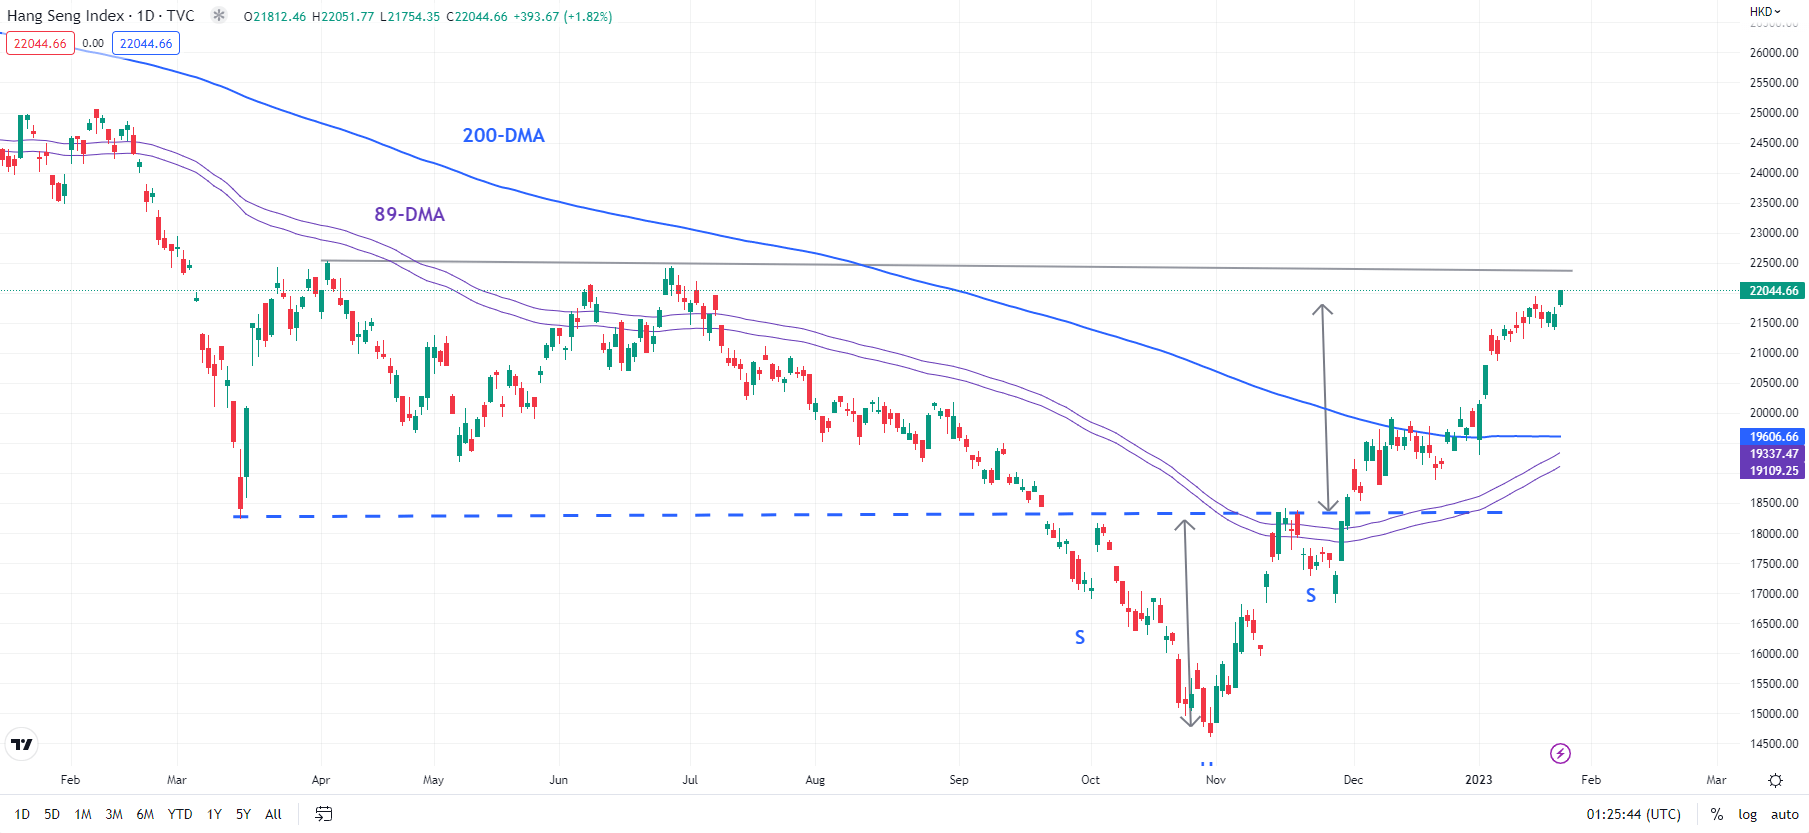
Chart Created Using TradingView
As pointed out in the previous update, the index has achieved the price objective of a reverse head & shoulders pattern triggered last month – scenario 2 highlighted in November – the break mid-December above resistance at 18415 triggered the bullish pattern (the left shoulder is the early-October low, the head is the end-October low, and the right shoulder is the November 22 low), paving the way toward 21800, the target of the pattern. The Hang Seng Index is now approaching another barrier at the April and July 2022 highs of 22450-22500. Any break above could open way toward the 200-week moving average (now at about 24875).
Hang Seng Index Weekly Chart
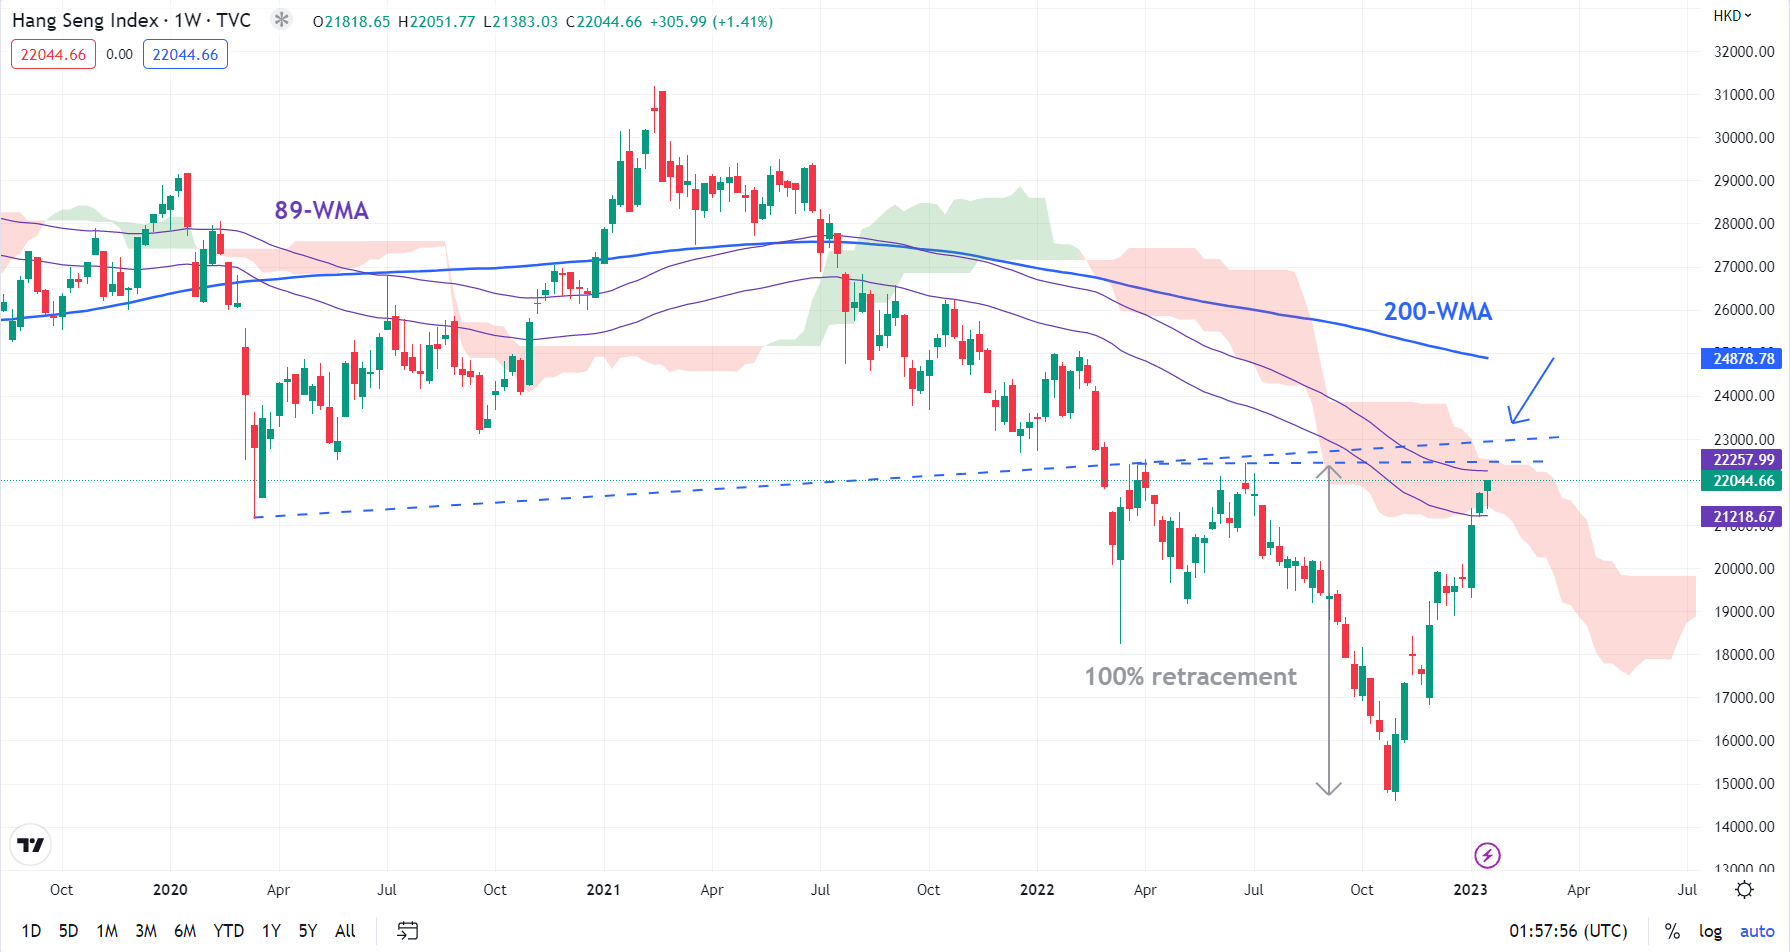
Chart Created Using TradingView
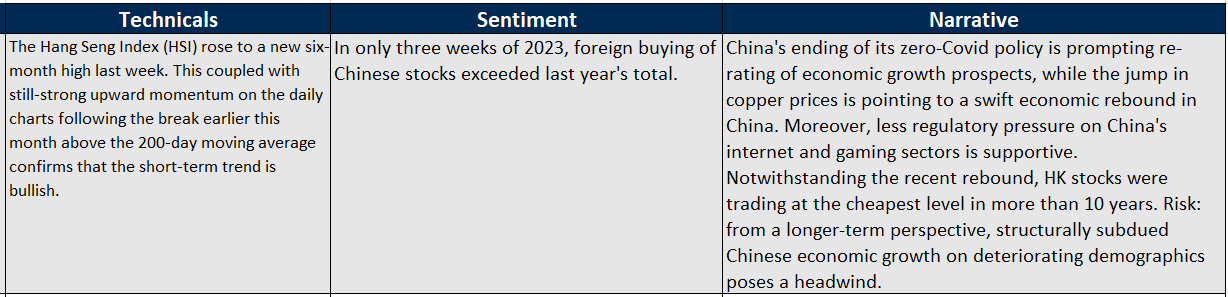
From a medium-term perspective, the strong rebound from the end of last year raises the odds that the worst could be over for HK/China stocks. The index has retraced 100% of the July-October 2022 slide – a sign that bears are getting exhausted. This is further reinforced by the surge in inflows this month as China's ending of its zero-Covid policy is prompting re-rating of economic growth prospects (see table highlighting the broader narrative).
Recommended by Manish Jaradi
How to Trade the “One Glance” Indicator, Ichimoku
— Written by Manish Jaradi, Strategist for DailyFX.com
Comments are closed.