Hang Seng, CSI 300 Price Setups
HANG SENG, CSI 300 Index- Outlook:
- China manufacturing activity improved in August.
- The CSI 300 index and the Hang Seng Index have yet to witness material strength.
- What is the outlook and what are the key levels to watch?
Recommended by Manish Jaradi
The Fundamentals of Trend Trading
The improvement in China’s manufacturing activity is yet to impress Hong Kong/China equities. Indeed, the Hang Seng Index has surrendered its early gains.
China NBS manufacturing PMI rose slightly to 49.7 in August vs. 49.4 expected, and 49.3 in July. NBS non-manufacturing PMI slowed to 51.0 vs. 51.1 expected and 51.5 in July. While the manufacturing sector is still in contraction territory, the improvement provides comfort that the recent stimulus measures are spilling over the economy.
CSI 300 Index Daily Chart
Chart Created Using TradingView
Thursday’s data is in line with the recent less-worse-than-expected China macro data which broadly have been underwhelming, according to the Economic Surprise Index (ESI). The China ESI has rebounded slightly recently, but it is not too far from mid-2020 lows (Covid levels) which has prompted analysts to downgrade growth estimates for the current year.
Hang Seng Index Weekly Chart

Chart Created Using TradingView
Meanwhile, Chinese policymakers have responded with a spate of stimulus measures in recent weeks in an attempt to revive the faltering post-Covid recovery and a struggling property sector. However, the targeted measures are yet to translate into undervalued Hong Kong/China equities probably need more than just targeted stimulus measures to witness a sustainable rebound.
Hang Seng: Feeble rebound so far
On technical charts, the Hang Seng Index is attempting to rebound from near quite strong converged support at the May low of about 18000, slightly above the lower edge of a declining channel since early 2023 (now at about 16850). As highlighted in the previous update, this support area is crucial – any break below would raise the odds that the November-January 2023 rebound is over, shifting the balance of risks toward the downside. See “HK/China Equities Test the Line in the Sand; Hang Seng, CSI 300 Price Setups,” published August 17.
Hang Seng Index Daily Chart
Chart Created Using TradingView
The rebound in recent days is a welcome sign for bulls, but the index needs to clear the initial hurdle at 18500-19000 for the immediate bearish risks to fade. A stronger signal that a meaningful rally was underway would be a crack above the mid-June high of 20155. Until then, the balance of risks remains tilted toward the downside.
CSI 300 Index Monthly Chart

Chart Created Using TradingView
CSI 300: No material strength yet
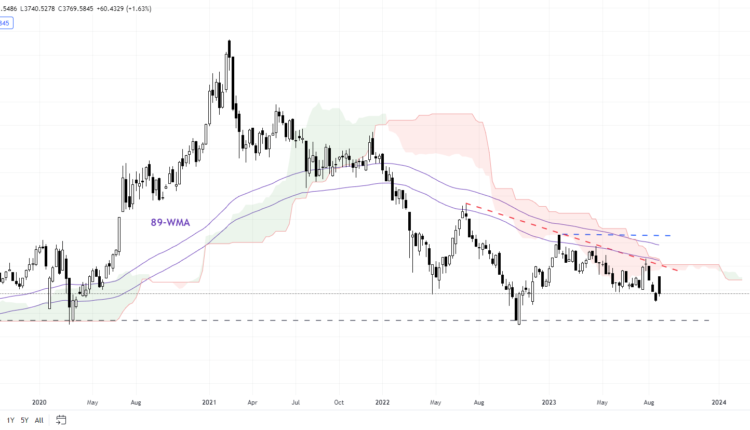
The CSI 300 index has been guided lower by the downward-sloping 89-week moving average, roughly around a downtrend line from mid-2022. The index has immediate resistance at the August high of 4065 to grapple with followed by the February high of 4268, slightly under the 200-week moving average (now at about 4400). Unless the 4300-4400 barrier is cleared, the broader bias remains sideways to down.
On the downside, major support has been on a horizontal trendline since 2019 (at about 3500). Any break below could initially pave the way toward the 2019 low of 2935.
Recommended by Manish Jaradi
Traits of Successful Traders
— Written by Manish Jaradi, Strategist for DailyFX.com
— Contact and follow Jaradi on Twitter: @JaradiManish


Comments are closed.