GC 1923 Still in Play – Can Bulls Tag 2k?
Gold Talking Points:
- The bullish trend in Gold has continued with another fresh seven-month-high printing yesterday, just inside of the 1950 level.
- Buyers were unable to do much after that test, however, and prices have slid right back to the key level of 1923, which was the all-time-high for almost nine full years before the 2020 summer breakout.
- The analysis contained in article relies on price action and chart formations. To learn more about price action or chart patterns, check out our DailyFX Education section.
Recommended by James Stanley
Get Your Free Gold Forecast
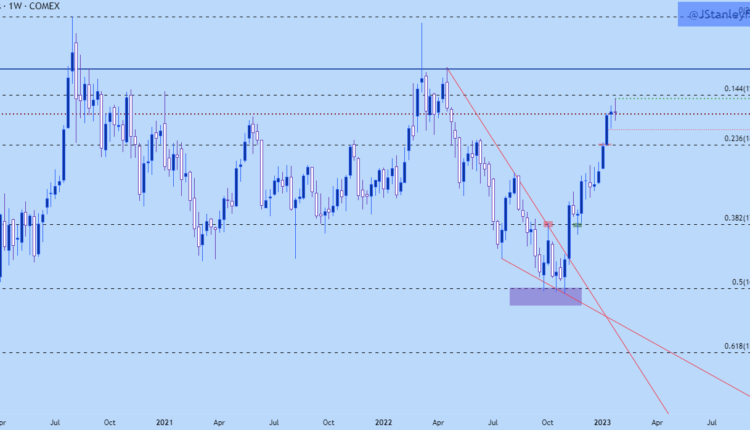
It was just a few months ago that Gold prices were hanging by the edge of support with heavy downside breakdown potential. The month of October was particularly important as a support level at 1628 was tested three separate times. This is the 50% mark of the 2018-202 major move in Gold and as that support was setting last October, that allowed for the build of a falling wedge formation which is often approached with the aim of bullish reversals.
The bullish reversal began to take-hold in November and as US yields continued to fall, hopeful that the Fed is/was/might be nearing a potential shift in policy, perhaps not a pivot into rate cuts but, just slower hikes.
That theme of Gold strength is still running today with yet another fresh high showing during yesterday’s trade, with Gold prices pulling up just shy of the 1950 level before starting to pull back.
Gold Weekly Price Chart
Chart prepared by James Stanley; Gold on Tradingview
Gold prices have been aggressively bid since that November breakout, which is well illustrated on the below four-hour chart, highlighting the aggressively sloped trendline from which price has pulled away which helps to show just how much strength has been pricing-in here.
The past couple of weeks has seen some moderation of that strength, however, as the move has begun to find some pretty significant congestion after running into a key level at 1923, which was the 2011 swing high. That high held for nine years until finally being traded through in the summer of 2020 when Gold prices jumped beyond the 2k level, albeit temporarily.
Gold Four Hour Price Chart

Chart prepared by James Stanley; Gold on Tradingview
Gold Resistance Tests
Of recent, topside breakouts in Gold have been a moderated a bit as each higher-high has been barely breaking above the prior high before price pulls back. This can be indicative of a heavily long market with traders taking profits on quick pops to fresh highs; and then reacting to support after prices pull back.
But, this could also be the first step to a pullback as it’s the same type of behavior that leads into rising wedge formations, with bullish pushes tempered while buyers remain fairly active upon tests of support or at lows.
And we’ve seen that over the past week with 1923, but this morning brought a fresh lower-low as price temporarily tested below 1923 before jumping back above.
At this point, bulls still have control, but we may be nearing a point where that starts to shift. From the daily chart below, we can see where that lack of enthusiasm upon tests of fresh highs has led to the build of the mirror image of the first formation looked at in this article as a rising wedge. Such formations are often approached with the aim of bearish reversals and we’re still seeing that follow-through support at 1923.
This can start to open the door to reversal potential but for the formation to trigger, sellers are going to need to continue to push in order to create additional lower lows. The 1902 support area could be of interest for such a scenario.
Until greater evidence of a sell-off, bulls are in-control and the next significant spot of resistance is a little-higher on the chart, around 1970.
Gold Daily Price Chart
Chart prepared by James Stanley; Gold on Tradingview
— Written by James Stanley
Contact and follow James on Twitter: @JStanleyFX


Comments are closed.