GBP/USD with Modest Gains but Remains at the Mercy of the DXY
GBP PRICE, CHARTS AND ANALYSIS:
For your Free Forecast Guide to Q3 on the GBP, Download It Below Now
Recommended by Zain Vawda
Get Your Free GBP Forecast
Read More: US Dollar Forecast: Will Fed Chair Powell Inject Further Momentum at Jackson Hole?
GBP held its own last week against its G7 peers with expectations for higher rates in the UK underpinning the Pound. The US Dollars ongoing rally met with GBP buying pressure has left the pair rangebound for about 3 trading weeks with a breakout elusive at this stage.
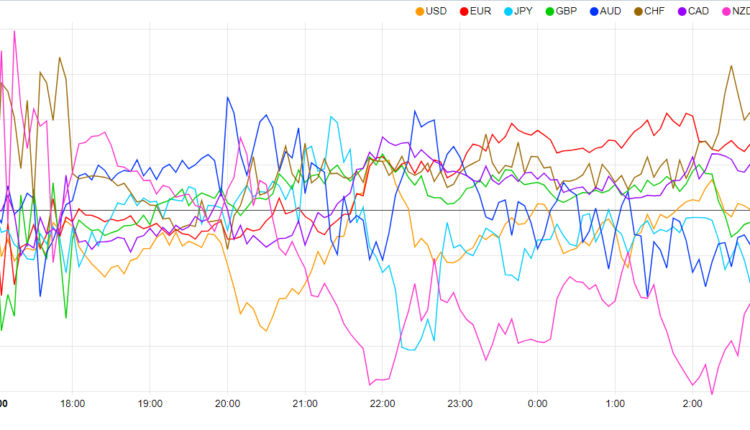
Currency Strength Chart: Strongest – CHF, Weakest – NZD.
Source: FinancialJuice
The currency strength chart above shows both the US Dollar and GBP in the middle in terms of strength this morning as the ongoing tug of war looks set to continue.
DOLLAR INDEX (DXY) AND CHINA RATE CUT
The Dollar index for its part enjoyed a 5th successive week of gains with a key stride being made as it broke above the 200-day MA. Safe-haven flows coupled with rising yields have kept the greenback supported but challenges do lie ahead.
Market participants were hoping for an improvement in sentiment this week with improvement and a possible rate cut by China this morning. The PBoC did cut its 1Y lending rate to a record low but surprised markets by keeping the 5Y rate steady. Calls intensified last week following fears of a contagion from the Chinese real estate sector as firms struggle to meet obligations while around 6 investment banks have also downgraded growth prospects for the Dragon nation.
It will be interesting to gauge the impact of the rate cut from China on sentiment as the US session arrives. The DXY largely benefitted from the uncertainty and poor risk sentiment last week, will that continue ahead of the Jackson Hole Symposium?
Dollar Index (DXY) Daily Chart

Source: TradingView, Chart Created by Zain Vawda
Given the Rangebound Nature of GBPUSD at Present Download your Free Guide to Range Trading Below
Recommended by Zain Vawda
The Fundamentals of Range Trading
RISK EVENTS AHEAD
A very limited week in terms of data releases from the UK with the highlights coming in the form of the S&P Global Manufacturing Flash PMI and GfK Consumer Confidence on Wednesday and Friday respectively. Both of these are mid-tier data releases and could result in some short-term volatility. However, a break of the recent range on Cable may require either a significant miss/beat of the forecasted figure or a significant change in risk sentiment.
From the US we do have the Jackson Hole Symposium which kicks off on Thursday and does have the potential to serve as a catalyst for a Cable breakout. Given the current geopolitical climate as well as the Dollar resurgence since the middle of July there is a real chance that Central Bankers opt for a more cautious and pragmatic approach. This could mean we get no real change in the recent rhetoric from Central Bankers except some comments around China and the potential impacts of its economic malaise. This could obviously impact risk sentiment and stoke volatility.

For all market-moving economic releases and events, see the DailyFX Calendar
TECHNICAL OUTLOOK AND FINAL THOUGHTS
GBPUSD has been ticking lower since the fresh YTD high on July 13 as price remains compressed between the 1.2630 mark 100-day MA and the 50-day MA around the 1.2790 mark. Cable has been caught in a range now for the last 15-16 trading days (pink rectangle on chart) with attempts to break the high and the low of the range met with aggressive buying or selling pressure.
A break and candle close above the 50-day MA faces resistance at the 1.2849 mark (June 16 swing high) before a retest of 1.3000 becomes a possibility. The 100-day MA serving as support at present with a break and candle close below finally opening up a potential retest of the psychological 1.2500 level.
Cable appears to be in dire need of a catalyst at the minute with the seasonally choppy August price action continuing to reign supreme. Range bound opportunities remain but deciding on a clear direction from a medium-term perspective is nigh impossible at this stage.
Key Levels to Keep an Eye On:
Support levels:
- 1.2680
- 1.2620 (100-day MA)
- 1.2500
Resistance levels:
- 1.2790 (50-day MA)
- 1.2850
- 1.3000 (psychological level)
GBP/USD Daily Chart

Source: TradingView, Chart Created by Zain Vawda
IG CLIENT SENTIMENT DATA
IG Retail Trader Sentiment shows that 53% of traders are currently NET LONG on GBPUSD. The ratio of long to short is 1.12 to 1.
For a more in-depth look at EUR/GBP sentiment and the changes in long and short positioning, download the free guide below.
| Change in | Longs | Shorts | OI |
| Daily | 9% | 2% | 5% |
| Weekly | -7% | 7% | -1% |
— Written by Zain Vawda for DailyFX.com
Contact and follow Zain on Twitter: @zvawda


Comments are closed.