GBP/USD, GBP/AUD, GBP/NZD Price Setups
British Pound Vs US Dollar, Australian Dollar, New Zealand Dollar – Price Setups:
- GBP/USD is struggling around resistance on the 200-week moving average.
- GBP/AUD and GBP/NZD look toppish.
- What is the outlook on key GBP crosses and what are the key levels to watch?
Recommended by Manish Jaradi
Get Your Free Top Trading Opportunities Forecast
The chances of a smaller interest rate hike at the Bank of England’s (BOE) meeting on Thursday are growing as UK price pressures appear to be finally moderating from elevated levels.
Given that inflation remains well above BOE’s comfort range, it will probably be too soon to declare victory even with the downside surprise in UK June CPI. Elevated inflation and solid growth in wage growth in May point to a 25 basis points move, rather than 50 basis points.
The key focus will be on BOE’s forward guidance – a data-dependent approach Vs a reiteration of further tightening given persistently sticky inflation. With speculative long GBP positioning still around the highest level since 2014, GBP could decline in the former case, while GBP could struggle to sustain gains in the latter case as forward-looking price and activity indicators point to downward momentum in underlying price pressures. Still, the downside in GBP supported given still-wide interest rate differentials with some of its peers.
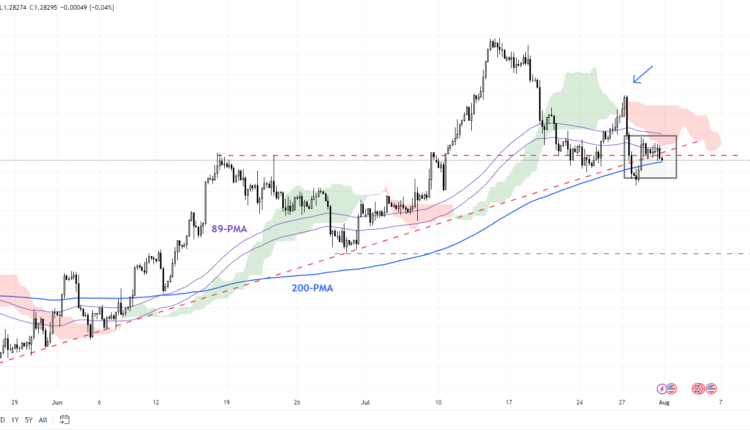
GBP/USD 240-minute Chart
Chart Created by Manish Jaradi Using TradingView
GBP/USD: Could soften in the near term
GBP/USD’s failure to sustain gains above stiff resistance on the 200-week moving average, roughly coinciding with the upper edge of a rising channel since early 2023 raises the risk of minor weakness in the near term given overbought conditions. See the previous update that pointed out the risk that the upward pressure in GBP/USD could be easing – “What’s Changed for British Pound After UK CPI? GBP/USD, EUR/GBP, GBP/AUD Price Setups,” published July 20.
GBP/USD Weekly Chart

Chart Created by Manish Jaradi Using TradingView
Zooming into intraday charts, cable’s failed attempt to rise past the upper edge of the Ichimoku channel on the 240-minute charts has created a lower high for the first time in recent weeks. So far, the pair has been holding above strong converged cushion around – an uptrend line from the end of June and the 89-period moving average. However, the pair looks vulnerable to a fall below the support. Such a break could pave the way toward the end-June low of 1.2600.
GBP/USD Daily Chart
Chart Created by Manish Jaradi Using TradingView
Beyond the daily timeframe, as the previous update pointed out, from a medium-term perspective, the rise this month to a one-year high in May confirmed the higher-tops-higher-bottom sequence since late 2022, leaving open the door for some medium-term gains. But cable may have to soften slightly before it embarks on the next leg higher (see “British Pound Buoyant Ahead of BOE: How Much More Upside?”, published May 8).
GBP/AUD Weekly Chart

Chart Created by Manish Jaradi Using TradingView
GBP/AUD: Risks turning down
GBP/AUD’s rally is losing steam as it tests a vital ceiling on a horizontal trendline from 2021, at about 1.9200 – a confirmation of this is the failure this week to build on to Friday’s sharp gains. The cross risks a retreat in the near term, initially toward the late-July low of 1.8850, with strong support at the June low of 1.8500.
GBP/NZD Daily Chart
Chart Created by Manish Jaradi Using TradingView
GBP/NZD: Overbought conditions point to some consolidation
GBP/NZD has struggled to extend gains in the past couple of months – a reflection of overbought conditions on higher timeframe charts. Any break below immediate support at the July low of 2.05 could open the way toward 2.02.
Recommended by Manish Jaradi
How to Trade GBP/USD
— Written by Manish Jaradi, Strategist for DailyFX.com
— Contact and follow Jaradi on Twitter: @JaradiManish


Comments are closed.