GBP/USD extends gains near 1.2630 on subdued US Dollar
- GBP/USD could reach the resistance level at 1.2650.
- Technical indicators suggest testing 1.2700 followed by September’s high.
- The psychological level of 1.2600 could act as immediate support following the seven-day EMA.
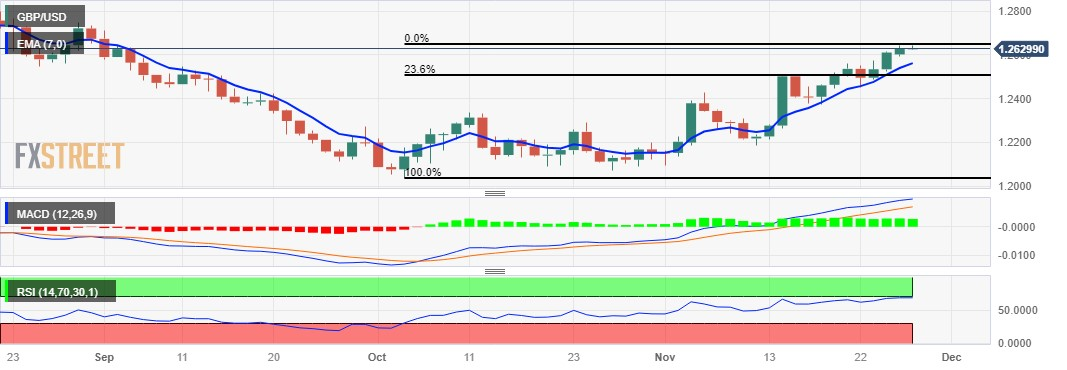
GBP/USD continues its winning streak that began on Thursday, trading higher around 1.2630 during the Asian session on Tuesday. The Pound Sterling (GBP) shows strength against the US Dollar (USD) for the fourth consecutive day, showcasing the resilience of the UK economy. This steadfast performance comes despite the tightening measures implemented by the Bank of England (BoE).
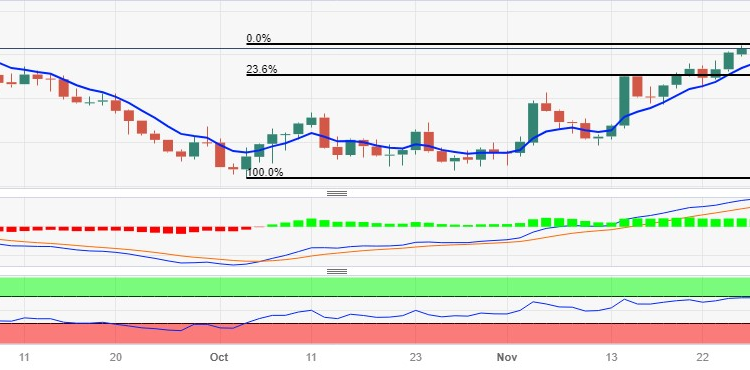
The GBP/USD pair could meet the resistance barrier at 1.2650. The Moving Average Convergence Divergence (MACD) line, positioned above the centerline and exhibiting divergence above the signal line, implies a strong momentum in the GBP/USD pair.
Additionally, the technical indicators for the GBP/USD pair are signaling a bullish outlook. The 14-day Relative Strength Index (RSI) above the 50 level indicates upward support, suggesting that the pair could reach the 1.2700 psychological level followed by September’s high at 1.2712.
On the downside, the GBP/USD pair could find support around the psychological level at 1.2600 following the seven-day Exponential Moving Average (EMA) at 1.2562 level aligned with the 1.2550 major level.
A decisive break below the level could push the GBP/USD pair to navigate the next support area around the 23.6% Fibonacci retracement at 1.2504 lined up with the 1.2500 psychological level.
GBP/USD: Daily Chart


Comments are closed.