
It was a slow start to the trading week before market players started placing their bets ahead of the major catalysts, particularly the U.S. CPI report and three central bank decisions.
Top-tier U.S. events turned out to be a bit of a surprise, including U.S. CPI falling short of estimates while the FOMC stayed very hawkish despite hitting the pause button with their rate hikes.
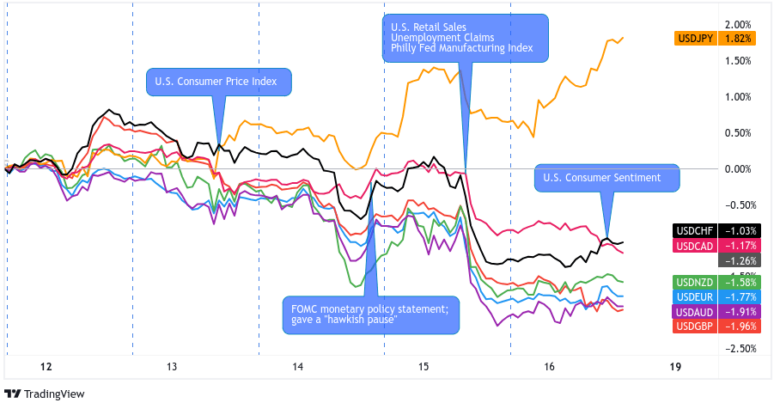
Although the Greenback managed to rake in some gains when policymakers dropped tightening hints, the U.S. currency is trailing behind most of its peers, along with the lower-yielding yen.
USD Pairs

Overlay of USD vs. Major Currencies Chart by TV
The U.S. currency was off to a pretty solid start, as dollar bulls were hopeful that the inflation report could come in strong and lift the odds of more Fed tightening.
However, the actual figures fell short of estimates, leading many to doubt that the U.S. central bank could keep up its tightening cycle.
To the surprise of some, the FOMC voted unanimously to keep interest rates on hold at 5.00-5.25% for the time being while still suggesting that two more rate hikes could be on the horizon.
Dollar sentiment quickly turned on Thursday with another weekly jobless claims report signaling employment weakness, overshadowing a generally positive U.S. retail sales update.
🟢 Bullish Headline Arguments
FOMC kept the Fed Funds rate range at 5% to 5.25% with a unanimous vote, but did signal further tightening (maybe two more hikes) still needed; no member signaled a cut in 2023
Preliminary U.S. consumer sentiment read for June rose to 63.9 vs. 59.2 in May – University of Michigan; 1-year inflation expectations fell from 4.2% to 3.3%
🔴 Bearish Headline Arguments
U.S. CPI for May: 4.0% y/y (4.3% y/y forecast) vs. 4.9% y/y previous; Core CPI lower from 5.5% y/y to 5.3% y/y
U.S. producer prices for May: -0.3% m/m (0.1% m/m forecast; 0.2% m/m previous); Core PPI came in at 0.2% m/m (0.1% m/m forecast; 0.2% m/m previous)
EUR Pairs

Overlay of EUR vs. Major Currencies Chart by TV
The shared currency cruised higher against most of its forex peers since euro traders had been pricing in another interest rate hike from the ECB.
Mid-tier economic data such as the ZEW economic sentiment surveys and the eurozone industrial production report also buoyed hawkish central bank expectations.
Come statement day, not only did ECB head Lagarde deliver on a 0.25% interest rate increase but also hinted that another tightening move could be in the cards for July.
🟢 Bullish Headline Arguments
Eurozone’s industrial production rebounded by 1.0% m/m in April after a 2.6% drop in March
German ZEW economic sentiment index up from -10.7 to -8.5 in June vs. -13.4 forecast, eurozone reading down from -9.4 to -10.0 vs. estimated -12.1 reading
ECB hiked interest rates by 0.25% as expected and confirmed that reinvestment of bond purchases through Asset Purchase Program to end next month
ECB head Lagarde hinted that another interest rate hike is likely in July, as inflation estimates were upgraded and that ECB has “more ground to cover”
GBP Pairs

Overlay of GBP vs. Major Currencies Chart by TV
Inflation expectations and BOE tightening hopes got a fresh boost from stronger-than-expected wage data and remarks from Governor Bailey reiterating that policymakers are wary of a wage price spiral.
Upbeat jobs data, along with a slight improvement in monthly GDP, also helped keep the pound afloat for the most part of the week.
🟢 Bullish Headline Arguments
U.K. claimant count fell by 13.6K instead of posting the estimated 21.4K rise in joblessness in May, earlier reading revised to show a smaller 23.4K increase in unemployment from initially printed 46.7K
U.K. average earnings index accelerated from 6.1% to 6.5% in the three-month period ending in April, reflecting stronger inflationary pressures
BOE Gov. Bailey said in a speech before the House of Lords Economics Affairs Committee that “we’ve got a very tight labor market” and that the slowdown of inflation is “taking a lot longer than expected.”
U.K. April GDP returns to positive territory with 0.2% m/m growth (from -0.3% in March) thanks to higher consumer spending and fewer labor strikes
🔴 Bearish Headline Arguments
U.K. industrial production down by 0.3% m/m in April vs. -0.1% expected, -0.7% in March
CHF Pairs

Overlay of CHF vs. Major Currencies Chart by TV
The franc had a mixed run for the week, as it chalked up significant gains to its lower-yielding rivals like the yen and dollar but gave up some ground to commodity currencies and European peers.
There were a couple of data points out of the Swiss economy, namely the PPI and import prices report, and these reflected weaker inflationary pressures, but it’s more likely the broad positive in risk sentiment was a bigger influence on broad franc movements this week.
🔴 Bearish Headline Arguments
Switzerland May producer and import prices -0.3% vs +0.2% m/m prior
State Secretariat for Economic Affairs said Switzerland’s consumer prices will rise 2.3% this year, lower than the 2.8% rate in 2022
AUD Pairs

Overlay of AUD vs. Major Currencies Chart by TV
The Aussie put up a good fight to hold on to its gains from the previous week, despite mostly downbeat data from its main trade partner China.
Stronger consumer sentiment, jobs data, and inflation expectations are likely keeping Aussie bulls hopeful for another RBA hike in their next meeting. And broad positive risk sentiment likely helped lift the currency significantly against JPY and USD.
🟢 Bullish Headline Arguments
Australia’s Westpac consumer sentiment index posted a 0.2% uptick in June, following earlier 7.9% drop
People’s Bank of China cut 7-day reverse repo rate from 2.0% to 1.9% and lowered onshore reference rate by 200 points
Melbourne Institute: Inflation expectations unchanged at 5.2% in June, wages are expected to grow by 1.6% over the next 12 months
Australia’s unemployment rate dipped from 3.7% to 3.6%, net employment +75.9K (vs. 18.6K expected, -4.0K previous) on increased vacancies and high demand for skilled labor
🔴 Bearish Headline Arguments
Australian NAB business confidence index fell from 0 to -4 in May to reflect worsening conditions
Chinese industrial output slowed from 5.6% y/y in April to 3.5% y/y in May while retail sales rose by 12.7% y/y in May, lower than the expected 13.6% and April’s 18.4% growth
CAD Pairs

Overlay of CAD vs. Major Currencies Chart by TV
The Loonie is also on track to recording a mixed performance for the week, as it chalked up big gains against the dollar and yen while staying in the red against its fellow commodity currencies.
There wasn’t much on the economic data front for Canada, which was probably why the Canadian dollar took cues from crude oil price action or functioned mostly as a counter currency.
🟢 Bullish Headline Arguments
Canada Manufacturing Sales for April: +0.3% m/m to C$72B; -1.6% y/y
Canada’s international transactions in securities for April: C$13.5B vs. -C$19.72B previous
🔴 Bearish Headline Arguments
API private crude oil inventories in the U.S. rose by 1.024 million barrels for the June 9 week instead of declining as expected
EIA crude oil inventory jumped by 7.9 million barrels instead of falling by 510K barrels as expected in the week to June 9
Canada Housing Starts for May: -23% m/m to 202.4K units;
Canada Wholesale Sales in April: -1.4% m/m to C$80.9B
NZD Pairs

Overlay of NZD vs. Major Currencies Chart by TV
Not even mostly downbeat mid-tier data from New Zealand was enough to stop the Kiwi from outperforming majority of its forex rivals, except for the Aussie and euro.
Indicators of trade performance and consumer spending pointed to weaker activity, underscoring the already downbeat quarterly GDP that put the economy officially in recession for Q1.
🔴 Bearish Headline Arguments
New Zealand May electronic card retail sales slumped 1.7% month-over-month in May versus estimated 0.3% uptick
NZIER downgraded New Zealand GDP forecast to a 0.6% expansion until March 2024, as estimates of household spending have been revised lower
New Zealand visitor arrivals slumped 16.9% month-over-month in April while the number of long-term and permanent migrants fell to its lowest level since October last year
New Zealand annual current account deficit unexpectedly narrows from 9.0% to 8.5% of GDP in Q1 2023
New Zealand is now technically in a recession with a -0.1% GDP q/q print in Q1 2023 after a 0.7% decline in Q4 2022
JPY Pairs

Overlay of JPY vs. Major Currencies Chart by TV
The yen is poised to end the week behind its forex counterparts, thanks to a combination of unimpressive economic data and another dovish monetary policy statement from the Bank of Japan, once again holding the ultra-low policy rate of -0.1%.
Broad risk sentiment was likely a factor as well as traders continue to see rising odds that the global interest rate hike cycle may be nearing its end.
🟢 Bullish Headline Arguments
Japanese BSI manufacturing index improved from -10.5 to -0.4 in April-June 2023 quarter versus estimated -4.2 reading, reflecting weaker pessimism
Japan’s exports inched 0.6% y/y higher in May, the slowest pace since February 2021, while imports dropped by 9.9% y/y thanks in part to lower fuel prices
🔴 Bearish Headline Arguments
Japanese producer prices rose by 5.1% year-over-year in May, slower than earlier 5.9% gain and expected 5.6% increase
Japan’s preliminary machine tool orders fell by 22.2% year-over-year in May, steeper than earlier 14.4% slide
Japan’s core machinery orders rose by 5.5% m/m in April, the first increase in three months. On an annualized basis, core orders fell by 5.9% (vs. -8.0% expected)
Comments are closed.