FX Play of the Day Recaps: July 17 – 20, 2023
It was a very busy week for the forex calendar, bringing both potential opportunities and challenges for our strategists this week.
It was arguably a net effective kind of week as we had two out of four strategies that were able to be on the right side of strong short-term momentum moves.

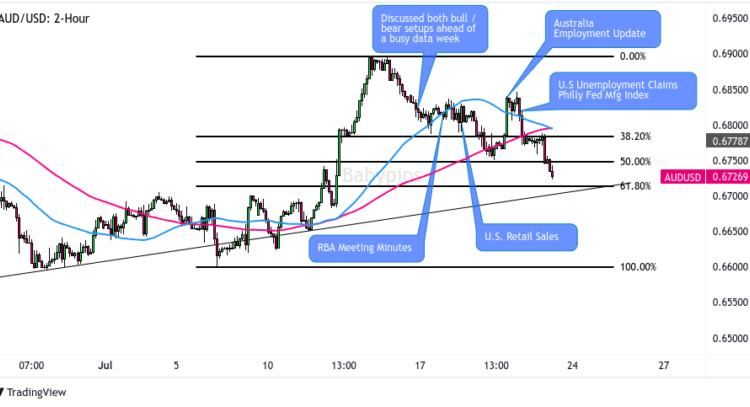
AUD/USD 2-Hour Forex Chart by TV
On Monday, we saw another dip in the Australian dollar to start the week during the Asia session, this time likely a reaction to the weaker-than-expected GDP and retail sales data from China. This once again supports the outlook that economic conditions are weakening in China, one of the biggest trade partners with Australia.
We thought that volatility would stay elevated in AUD/USD with the latest RBA meeting minutes, Australian employment and U.S. retail sales data up ahead, and we discussed various bull and bear scenarios for the pair dependent on those event outcomes. Well, our elevated volatility expectations came to pass as the heavy calendar prompted several moves / direction changes this week.
First, the RBA meeting minutes showed that the Reserve Bank of Australia is still open to tightening in August, but didn’t seem to have much influence as AUD/USD traded lower after the event. And we saw moves after the U.S. retail sales update for June, which came in below both expectations and the previous month, possibly prompting the bearish lean on the pair on rising recession worries.
It was the Australian jobs update that brought fast markets to AUD/USD Thursday, and boy was an interesting moment as traders actually started buying ahead of the data release, then picked up the buying pace after the data came in better-than-expected.
But the bullish sentiment on AUD/USD didn’t last very long as U.S. weekly jobless claims drew in U.S. dollar bulls during the Thursday U.S. trading session.
It’s tough to say whether or not this was effective or not given the amount of after event adjustments in perspective that needed to be made, but we think if the idea was that signals of Chinese and U.S. economic weakness rising was the base idea for a bearish bias, then this would arguably have been an effective pair to trade this week.

AUD/CAD vs. Crude Oil Futures: 30-min Forex Chart by TV
On Tuesday, we pointed out a short-term descending channel on AUD/CAD, likely driven by a mix of weakening sentiment due to weak Chinese data, and some support for the Loonie from rising oil prices.
We spotted Canadian CPI updates ahead to potentially influence the Loonie, with expectations of showing inflation conditions easing further, and if so, that could possibly lead to an upside break of the descending channel.
We also mentioned that if Canadian CPI data surprised positively, then we thought AUD/CAD could move lower with the current trend to retest the 0.8950 minor psychological area, a scenario that we were leaning towards, mainly due to the bearish momentum.
Canadian CPI data showed slowing on both a monthly and annual basis, and we did see a bearish reaction momentarily in the Canadian dollar, but no upside channel break ever developed. And it didn’t take long to attract Loonie buyers, correlating with the bullish turn in oil prices from the $74 handle that began on Tuesday.
That was likely the main driver for AUD/CAD’s broad move lower this week, benefiting our bearish lean on the pair, and it was enough to draw in sellers again after a short-term spike higher after the better-than-expected Australian employment update on Thursday.

GBP/AUD 30-min Forex Chart by TV
After the U.K. printed a weaker-than-expected CPI update on Wednesday, we set our sights on GBP/AUD as the volatility took the pair to a major support pattern area on the 15-minute chart.
With Australia set to release their employment updates during the Thursday Asia session, we saw the odds of volatility rising quickly for GBP/AUD, and that the support pattern noted would likely draw in traders to jump off from, with direction depending on how the data played out.
Generally, we leaned bullish on the pair due to market expectations of a weak Australian jobs update, which was quickly invalidated as Australia printed a stronger-than-expected update. This drew in sellers relatively quickly and brought the pair all the way down to the 1.8850 minor psychological level before the sell0ff exhausted.
No luck on Wednesday’s GBP/AUD price outlook for our bullish lean, but if you were able to quickly adapt to the surprise Australian jobs update and go short on the trendline break, that likely lead to a positive outcome for the short-term bears who risk managed well.

GBP/CHF 30-min Forex Chart by TV
On Thursday, we looked ahead to the upcoming U.K. retail sales event, potentially leaning long on Sterling on expectations the U.K. will give a positive update on consumer retail activity.
With that fundie bias, we looked at GBP/CHF as it was forming a double bottom on the 15-minute chart. This pattern tends to draw in technical buyers, and if risk sentiment leaned positive and/or U.K. retail sales did come in positive, we thought that a move up to retest the neckline and pivot point level (1.1120) was a possibility.
Not too long after our post, GBP/CHF shot higher during the U.S. trading session, without an apparent direct catalyst for the move. Sterling did broadly rally against the majors (minus the U.S. dollar), and after being beat up for most of the week, this may arguably be a case of repositioning (i.e., short covering) ahead of the U.K. retail sales update.
Whatever the case may be for the rally from the double bottom, GBP/CHF easily reached our discussed targets, first the “neckline” around 1.1100, then the Pivot Point line around 1.1120. It actually had enough momentum to reach the R1 pivot point area, marked on the chart in our original discussion.


Comments are closed.