
It was a busy week for FX traders out there, and over here, we had three out of five of our featured FX strategies do pretty well!
Check out this quick review to see how the price action and catalysts played out!
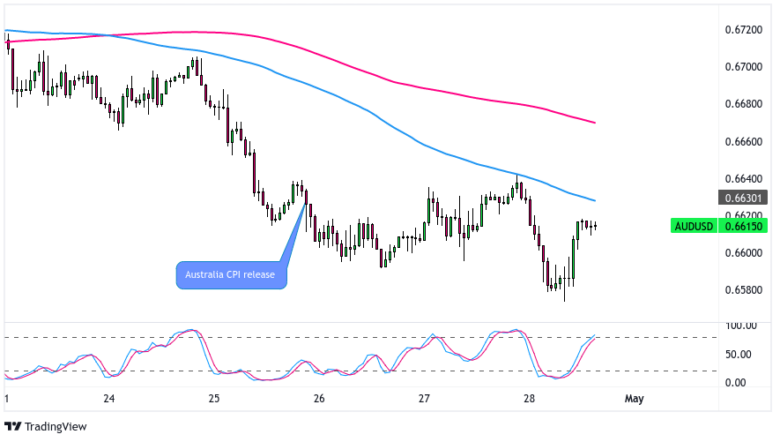
Forex Setup of the Week: AUD/USD – April 24, 2023

AUD/USD 1-Hour Forex Chart
On Monday, AUD/USD was our forex setup of the week with top-tier inflation reports on the calendar from Australia and the U.S. that could spark big volatility for the currency pair.
AUD/USD dropped sharply ahead of the highly anticipated AU CPI event, over 1 DATR, which raised the odds of two scenarios playing out on the event release: a “buy-the-rumor, sell-the-news” scenario or what we actually saw, not much movement in either direction.
For those of you who read our Australia CPI Event Guide on Monday and went with our bearish lean, it’s likely you took the short side of the pair. And congrats if you did as the drop was pretty large (over 100 pips) and the bears were able to hold onto most of the gains going into the weekend.
AUD/NZD: Tuesday – April 25, 2023

AUD/NZD 1-Hour Forex Chart
On Tuesday, we discussed a potential short strategy on AUD/NZD after the pair broke below both a rising lows pattern and rising simple moving averages on the 1-hour chart.
With the market trading around 1.0825 at the time of post, our strategy was to short AUD/NZD and target 1.0790 – 1.0800 area if AU CPI did come in weaker-than-expected. We also thought that pivot point level at 1.0870 was a potential resistance area that would hold on a bounce.
Unfortunately for us, we didn’t get that bounce, but that doesn’t mean it wasn’t a good week for the bears as AUD/NZD dropped like a rock this week, falling nearly 2 times the daily ATR to test trade around the 1.0700 ahead of the weekend.
USD/JPY: Tuesday – April 25, 2023

USD/JPY 1-Hour Forex Chart
We were feeling pretty confident on Tuesday and decided to put up another setup, this time on USD/JPY as the pair was trending higher and testing a resistance zone.
This was actually a tough one because fundamental arguments could be made for both the bulls and the bears, and the next move would ultimately depend on top tier economic updates and events coming at the end of the week.
We leaned cautiously bearish and thought that if we did see a downside break of the rising lows pattern, that could take the market to the 132.75 – 133.00 area.
USD/JPY actually did make several moves below the rising trendline, but wasn’t able to turn that to any downside moves. And unfortunately for our bearish lean, the BOJ event had everyone solidly back to bearish yen vibes, likely on speculation that the BOJ will not return to monetary policy normalization any time soon.
EUR/USD: Wednesday – April 26, 2023

EUR/USD 1-Hour Forex Chart
On Wednesday, we observed how EUR/USD seemed to be in consolidation mode, with the upcoming U.S. economic events likely to add some action to the pair.
We leaned bullish on the pair due to the technical setup on the 1-hour chart, citing a potential bounce off support, especially if U.S. durable goods data came in positive.
Well, that’s pretty similar to what played out, as buyers began jumping into the pair ahead of the U.S. durable goods orders event.
This correlates with broad euro strength against the majors, which may have been a reaction to commentary from ECB officials during the London session reiterating expectations of an ECB rate hike at their next meeting.
Unfortunately for the bulls, the upward momentum couldn’t hold, likely due to some profit taking ahead of the top tier economic releases from the U.S. on Thursday and Friday. Congrats if you were able to catch some short-term pips on that setup.
USD/CHF: Thursday – April 27, 2023

USD/CHF 1-Hour Forex Chart
On Thursday, we spotted this descending triangle on USD/CHF, with expectations that the U.S. dollar will likely make moves on upcoming major U.S. economic releases during the U.S. session.
Our expectations were that if the U.S. GDP report comes in as weak as the Atlanta Fed GDPNow tracker was suggesting, then USD could lose pips across the board including against CHF.
There were several ways to play that expectation, either scaling into a short position or waiting for a break below the descending triangle pattern for the more conservative types.
Unfortunately for the bears, neither situations played out as USD/CHF rallied hard ahead of the U.S. GDP event, broke the triangle to the upside, and for reasons unknown. Best guess is that USD/CHF was rallying with broad risk-on sentiment, likely sparked by a heavy round of positive U.S. earnings releases that was mostly positive.
We did get a much weaker-than-expected GDP read of 1.1% q/q vs. 2.3% q/q forecast, but that event pop higher was possibly due to the quarterly core PCE Price Index (the Fed’s preferred inflation metric) coming in super hot at 4.9% q/q vs. 4.1% q/q forecast.
So no luck for our strategy call here, but if you played the descending triangle as a straddle setup, it’s likely you caught the upside and hopefully you were able to take full advantage of that strong intraday move.
This content is strictly for informational purposes only and does not constitute as investment advice. Trading any financial market involves risk. Please read our Risk Disclosure to make sure you understand the risks involved.
Comments are closed.