FX Play of the Day: Is the Dollar in for More Pain Against the Franc?
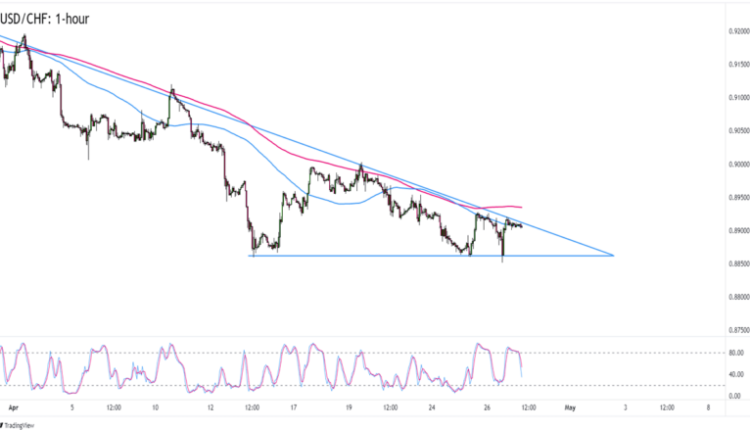
USD/CHF has been respecting a descending trend line as early as mid-March.
Then, two weeks ago, enough bulls showed up to defend the .8860 level and now the pair is sporting a descending triangle on the 1-hour time frame.
Will USD/CHF finally break outside its consolidation?

USD/CHF 1-Hour Forex Chart by TradingView
That will likely depend on how traders will react to today’s U.S. GDP report.
The markets currently expect Uncle Sam’s growth to come in at 2.0% in Q1 2023, a bit slower than the 2.6% uptick in Q4.
However, Atlanta Federal Reserve’s GDPNow, which is a running estimate of real GDP growth based on available economic data, sees Q1 GDP at 1.1% as of April 26. That’s a yuuuge downgrade from its 2.5% estimate in April 18 and the 2.0% growth that analysts are expecting!
It also doesn’t help the dollar’s case that investors still have banking sector AND debt ceiling concerns.
If today’s U.S. GDP report comes in as weak as the GDPNow tracker is suggesting, then USD could lose pips across the board including against CHF.
USD/CHF traders could take cues from the trend line and 100 SMA resistance zones holding and drag the pair to its .8860 April lows or even make new monthly lows.
USD/CHF has an average daily volatility of about 65 pips, so a trip to .8860 would be easy peasy in case of a downside GDP surprise.
USD sellers who expect more dollar weakness can scale in at current levels, place stops just above the trend line, and then aim for previous lows.
Not too confident about selling USD these days? You can also wait for a bit of momentum or even a clear breakout below the triangle support before you can consider riding USD/CHF’s downtrend.


Comments are closed.