FX Play of the Day: EUR/USD Closing in on Triangle Support
Check out these higher lows and lower highs on EUR/USD!
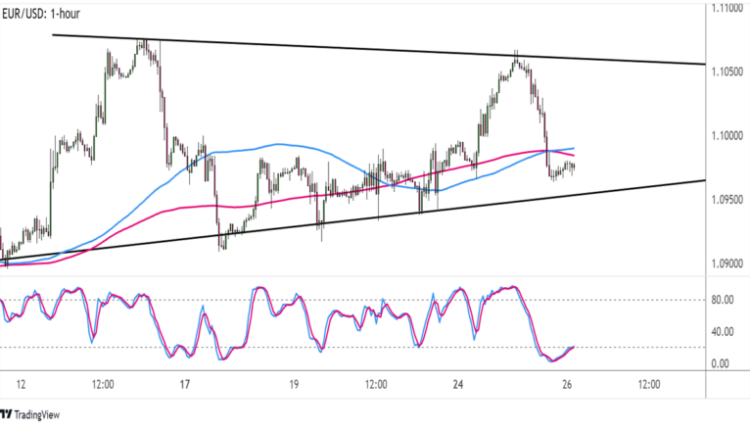
The pair is consolidating inside a triangle pattern on its hourly time frame, and it might be gearing up for a breakout soon.
Risk appetite has been switching on and off for the past few days, though, so we might still see a bit more sideways price action until the top-tier U.S. reports are released later on.
Here are the levels you should keep tabs on if you’re going for either a bounce or a break.

EUR/USD 1-hour Forex Chart by TradingView
Price is within striking distance of its triangle bottom above the 1.0950 minor psychological mark while technical indicators are hinting at a bounce.
For one, the 100 SMA just crossed above the 200 SMA to suggest that support is more likely to hold than to break. At the same time, Stochastic is starting to pull higher from the oversold region.
I’m even seeing a bit of bullish divergence, as the oscillator made lower lows since April 19 while EUR/USD had higher lows then.
In that case, the pair might still be in for another bounce off support, setting its sights back on the triangle resistance at the 1.1050 minor psychological mark.
While the dollar has been selling off sharply over the past few trading sessions, it could find some relief during the release of the U.S. March durable goods orders report.
Analysts are projecting some improvements, with the headline figure slated to rebound by 0.7% month-over-month after the earlier 1.0% slump. However, the core version of the report might print a slightly larger 0.2% dip compared to the earlier 0.1% decline.
Even if actual figures turn out strong, dollar traders might not be too keen about making big breakouts ahead of the U.S. advance GDP release later this week anyway. After all, slower growth figures are eyed, likely dampening hopes of more Fed tightening for the rest of the year.
Don’t forget that EUR/USD moves an average of roughly 80 pips per day, so a bounce off the 1.0975 area up to the 1.1050 triangle top would be well within its usual range.
This content is strictly for informational purposes only and does not constitute as investment advice. Trading any financial market involves risk. Please read our Risk Disclosure to make sure you understand the risks involved.


Comments are closed.