
Who’s ready to trade Canada’s CPI release later today?
If you’re hoping to catch a breakout, this chart pattern on CAD/JPY is worth watching.
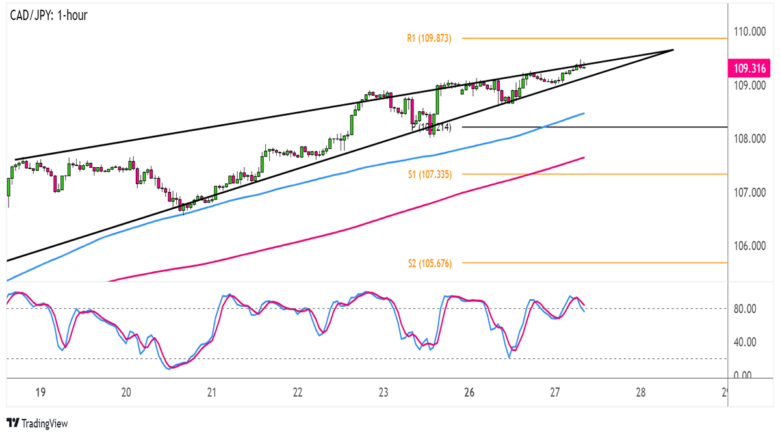
On the hourly chart below, you can see that the pair has formed higher lows and slightly higher highs to consolidate inside a rising wedge formation.

CAD/JPY 1-hour Forex Chart by TV
The consolidation is looking reaaally tight right now, which means that a breakout is bound to happen soon.
A move below the wedge support and the 109.00 major psychological mark might be enough to confirm that Loonie bears have won the round, possibly taking CAD/JPY down to the next downside targets.
Now the chart formation spans roughly 200 pips in height, so the resulting breakdown might be of the same size. Sellers might also book profits at the pivot point (108.21) or S1 (107.33).
Stochastic seems in favor of a bearish move, as the oscillator is already indicating overbought conditions and could be ready to head south.
Of course the direction of the breakout could largely depend on the outcome of Canada’s May CPI report, which is slated to show a dip in price pressures.
If that’s the case, the Canadian currency could be in for a sharp drop since weaker inflation might dash hopes of the BOC hiking interest rates in their next statement.
Stronger than expected CPI data and a break past R1 (109.87) near the 110.00 handle, on the other hand, could invalidate this setup.
Which way do you think CAD/JPY might break out?
This content is strictly for informational purposes only and does not constitute as investment advice. Trading any financial market involves risk. Please read our Risk Disclosure to make sure you understand the risks involved.
Comments are closed.