

FTSE 100 Lower, Dax Moves Higher While Dow Looks to Edge Up Following Reports of Debt Ceiling Deal
Article written by IG Chief Market Analyst Chris Beauchamp
FTSE 100, DAX 40, and Dow Jones – Analysis, Prices, and Charts
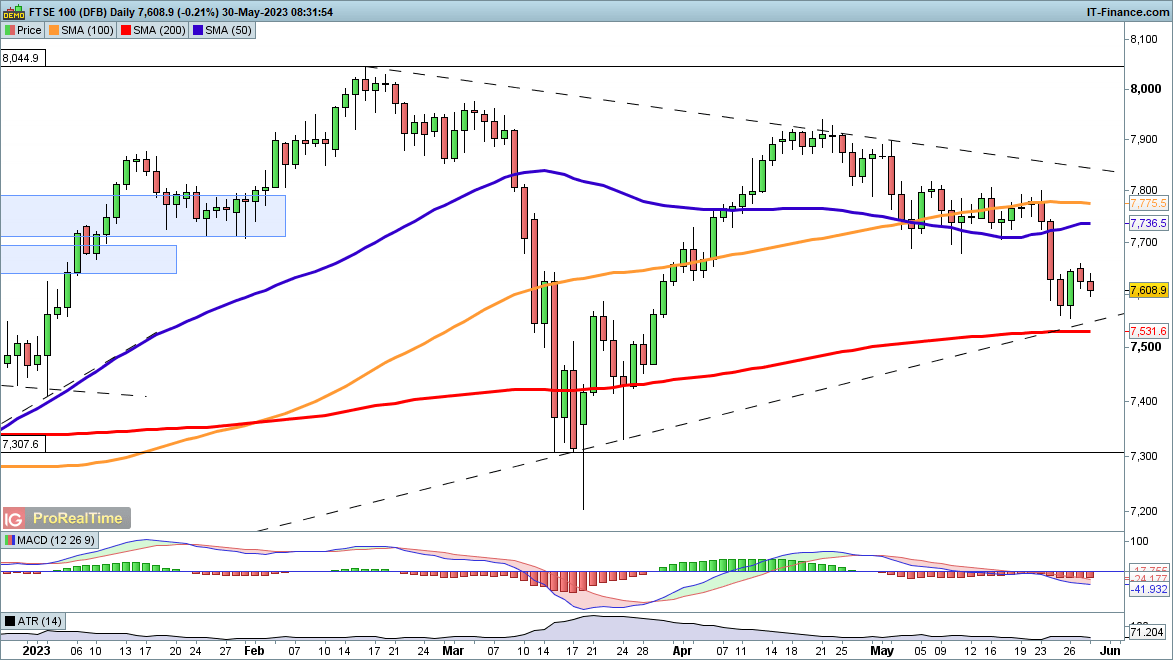
FTSE 100 mixed after long weekend
A turn lower in early trading has eroded some of Friday’s gains, and further losses might see the index head back towards rising trendline support from the September low, or down towards the 200-day SMA.
The failure to carry on the rally from Friday points towards renewed caution among investors and a fresh move higher seems unlikely while the debt ceiling remains unresolved. A deeper fall below 7500 brings the 7300 lows from March into view.
Alternately, the price needs a move back above 7650 to suggest a renewed push higher and another attempt to challenge trendline resistance from the February high.
FTSE 100 Daily Price Chart – May 30, 2023
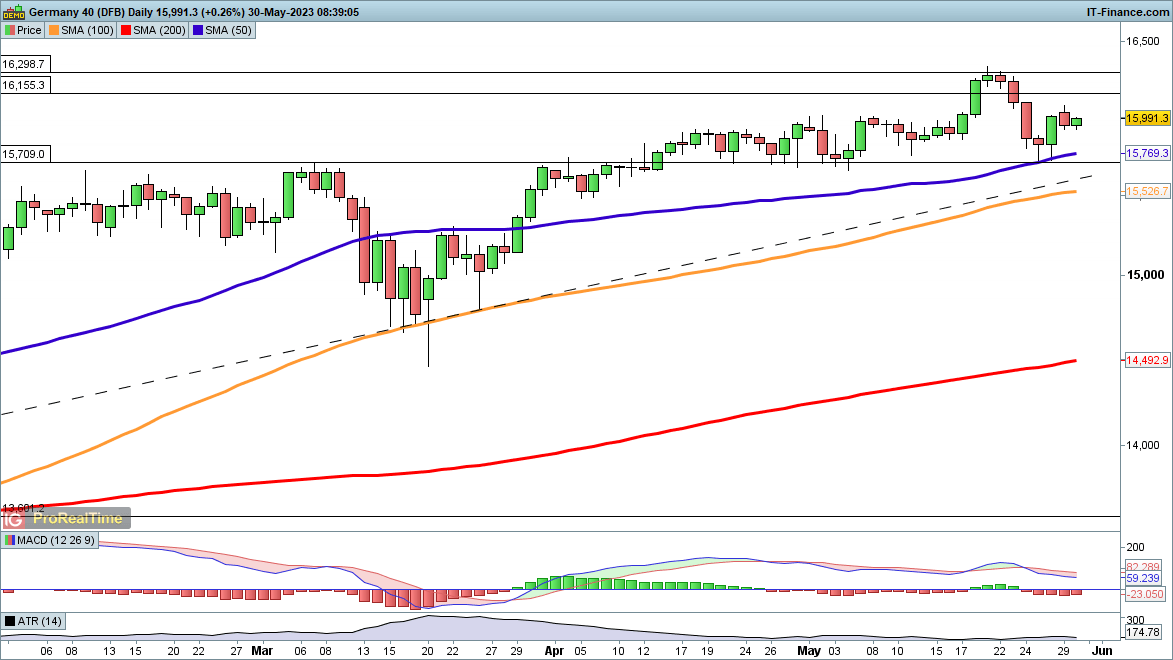
DAX 40 is steady in early trading
After pulling back yesterday the index is showing some early signs of strength, maintaining the bounce from the 50-day SMA.
Continued gains now target the 16,300 highs from last week, and would signal a restatement of the uptrend of the past six months, with new all-time highs now in prospect.
Buyers have reasserted control after the recent pullback, and it would need a move back below 15,750 to suggest a deeper retracement is at hand.
DAX 40 Daily Price Chart – May 30, 2023
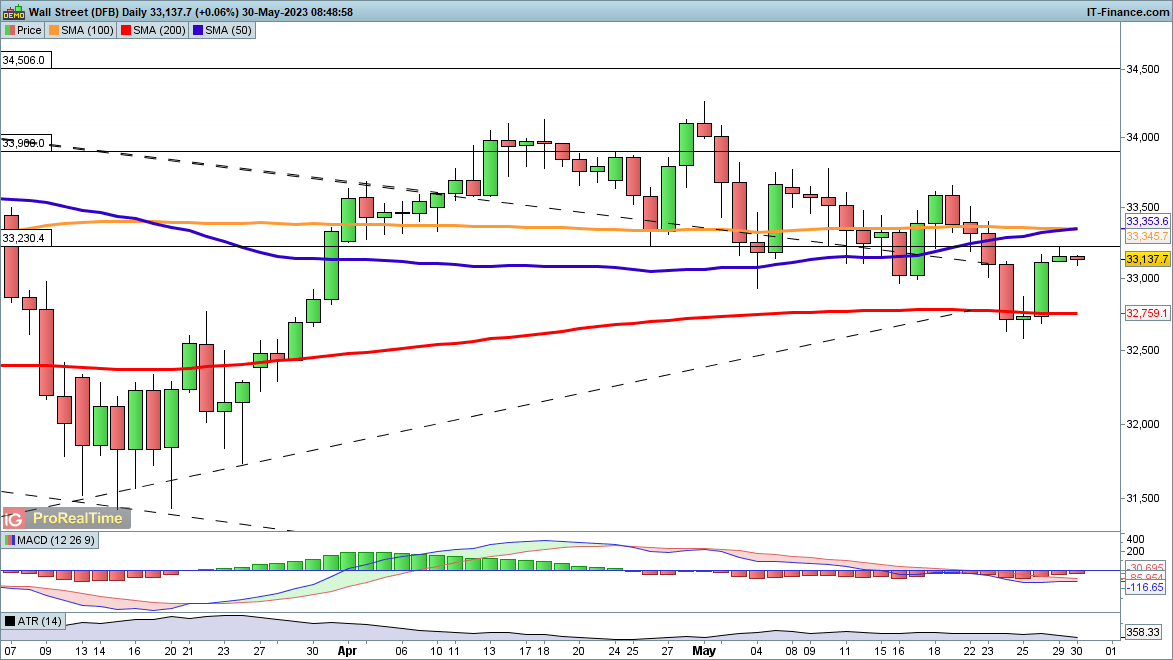
Dow Jones aims to build on Friday’s rally
US markets surged on Friday as news of a debt ceiling deal filtered through. Now the question is whether lawmakers can actually agree on a deal or whether we will see fresh volatility.
The Dow rallied back above the 200-day SMA on Friday. With US markets closed on Monday there was little sign of further upward momentum, but early trading on Tuesday has seen some initial buying pressure.
A move above the 33,230 level would bolster the bullish view, and from there the highs from mid-month around 33,600 come into play. Given that the debt ceiling is not fully resolved, we could see more downside, but it would need a move below 32,600 to suggest a bigger drop is in play.
Dow Jones Daily Price Chart – May 30, 2023
Comments are closed.