FOMC Communication Pivotal for Australian Dollar
AUD/USD ANALYSIS & TALKING POINTS
- Aussie bulls hoping for bullish continuation.
- US PPI & FOMC under the spotlight later today.
- AUD/USD trades within falling wedge formation.
Elevate your trading skills and gain a competitive edge. Get your hands on the AUSTRALIAN DOLLAR Q4 outlook today for exclusive insights into key market catalysts that should be on every trader's radar.
Recommended by Warren Venketas
Get Your Free AUD Forecast
AUSTRALIAN DOLLAR FUNDAMENTAL BACKDROP
The Australian dollar could not eek out any gains against the USD this week despite some positive consumer confidence data for the December period. US CPI rattled markets yesterday but swiftly pulled back to normality today. The US disinflation rate may be slowing and may make the latter leg of the push towards 2% that much more difficult. Coupled with a resilient Non-Farm Payrolls (NFP) report, significant rate cut expectations by the Federal Reserve may be premature.
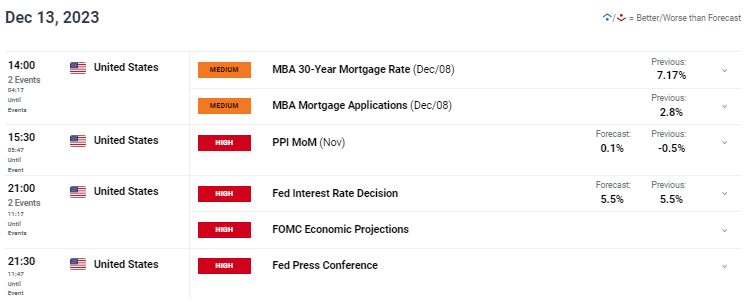
Yesterday, the Reserve Bank of Australia’s (RBA) Governor Bullock stated that policymakers would adopt a data dependent approach as we lead up to the next interest rate announcement on the 6th of February 2024. Later today (see economic calendar below), the Fed will come into focus with a likely rate pause. What will be of interest is the messaging from Fed Chair Jerome Powell and whether or not he pushed back against the revised dovish repricing. While I do not expect there to be any talk of additional rate hikes, the Governor may reiterate the need to keep monetary policy in restrictive territory for longer to continue to bring down inflation. In summary, identifying the possible start of easing as well as its size could be crucial moving forward. Currently, money markets price in 110bps of cumulative rate cuts in 2024 with the first cut occurring in May.
US PPI is set to tick higher and being touted as a leading indicator for CPI, any upside surprise could weigh negatively on the Aussie dollar.
AUD/USD ECONOMIC CALENDAR (GMT +02:00)
Source: DailyFX economic calendar
Trade Smarter – Sign up for the DailyFX Newsletter
Receive timely and compelling market commentary from the DailyFX team
Subscribe to Newsletter
TECHNICAL ANALYSIS
AUD/USD DAILY CHART

Chart prepared by Warren Venketas, TradingView
AUD/USD daily price action above shows a steady decline since testing the long-term trendline resistance zone (black), now trading below the 200-day moving average (blue). That being said, there is no real directional bias with the Relative Strength Index (RSI) favoring neither bullish nor bearish momentum and prices forming a falling wedge type chart pattern (dashed black line) A breakout above wedge resistance could bring the 0.6596 swing high once more – potentially via a dovish outcome from the FOMC later this evening.
- 0.6700
- Trendline resistance
- 0.6596
- Wedge resistance
- 200-day MA
Key support levels:
- Wedge support
- 0.6500
- 0.6459/50-day MA
- 0.6358
IG CLIENT SENTIMENT DATA: BEARISH (AUD/USD)
IGCS shows retail traders are currently net LONG on AUD/USD, with 65% of traders currently holding long positions.
Download the latest sentiment guide (below) to see how daily and weekly positional changes affect AUD/USD sentiment and outlook.
| Change in | Longs | Shorts | OI |
| Daily | 9% | -15% | -1% |
| Weekly | 2% | -9% | -2% |
Contact and followWarrenon Twitter:@WVenketas


Comments are closed.