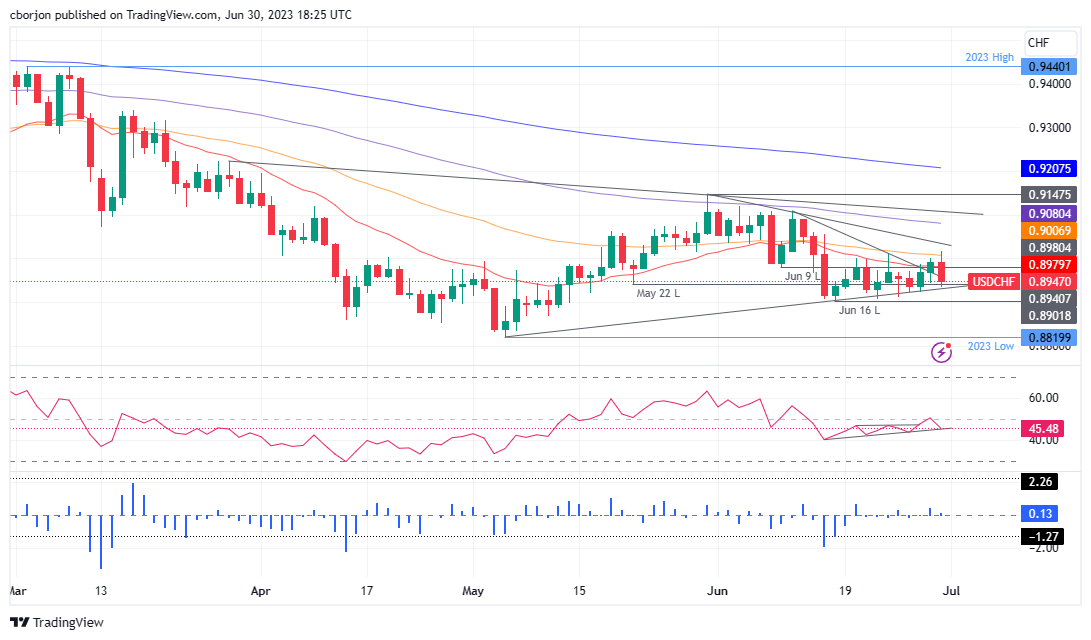
Fails at 0.9000, dips below key support levels amidst fading selling pressure
- USD/CHF drops below key 0.90 level, extending losses as sellers eye a test of the 0.8900 mark.
- Despite losses, fading selling pressure indicated by RSI and positive three-day RoC signals potential recovery.
- If breached, initial resistance at 20-day EMA opens path to 50-day EMA at 0.9007 and beyond.
USD/CHF fails to decisively crack the 50-day Exponential Moving Average (EMA) at 0.9007, drops beneath the 0.90 figure, and extends its losses below technical support levels, as sellers see a test of the 0.8900 mark. At the time of writing, the USD/CHF trades at 0.8947, down 0.51%.
USD/CHF Price Analysis: Technical outlook
The USD/CHF is neutral to downward biased, as price action remains constrained within the 0.89/0.90 area for the last two trading weeks. The Relative Strength Index (RSI) indicator portrays sellers in charge, but it should be said the RSI has printed higher throughs, suggesting selling pressure is fading. In the meantime, the three-day Rate of Change (RoC) remains positive despite the USD/CHF is printing losses.
If USD/CHF continues to edge lower, the first support would be 0.8900. A breach of the latter will expose the year-to-date (YTD) low of 0.8819. Conversely, if buyers reclaim the 20-day EXMA at 0.8979, that will expose the 50-day EMA at 0.9007. Once cleared, the next resistance would be the 100-day EMA at 0.9080 before challenging the 0.9100 mark.
USD/CHF Price Analysis: Price Action – Daily chart


Comments are closed.