

The US reporting season has come to an end. The largest companies have provided their financial results for Q2 2023. Let's pay attention to the titans of the American market Meta (Facebook), Apple, Amazon, Netflix, and Alphabet (Google). How did FAANG report? What to expect from stock prices?
FAANG revenue and net income
The companies reported differently in terms of revenue and net profit. Mark Zuckerberg's company provided the strongest report. Meta's revenue increased by 11.7%, while the company's net income increased by almost 36.5%.
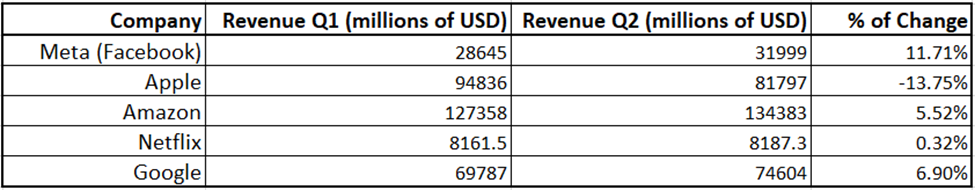
FAANG Revenue.
Apple obtained the weakest report in comparison with the previous reporting period: a drop in revenue by 13.8% and a decrease in net profit by 17.7%.
In fairness, it should be noted that if we compare the company's financial results with the same period, but for 2022, then the picture is satisfactory. The company's revenue decreased by 1.4%, while net profit increased by 2.2%.
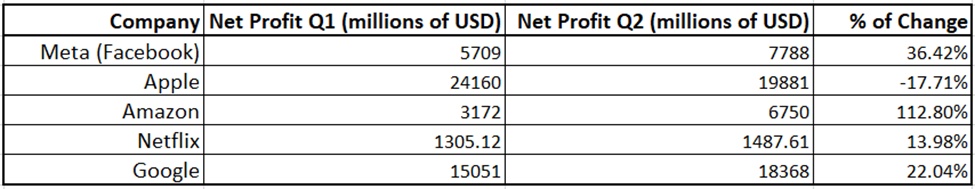
FAANG Net Profit.
FAANG debt
How has the debt of FAANG companies changed? It can be seen from the table that Meta has increased its debt load the most. The debt ratio increased by almost 3%.
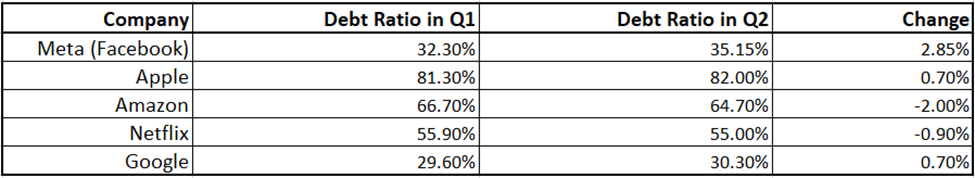
FAANG Debt Ratio.
Despite this, we note that Meta's debt ratio is one of the lowest among FAANG stocks.
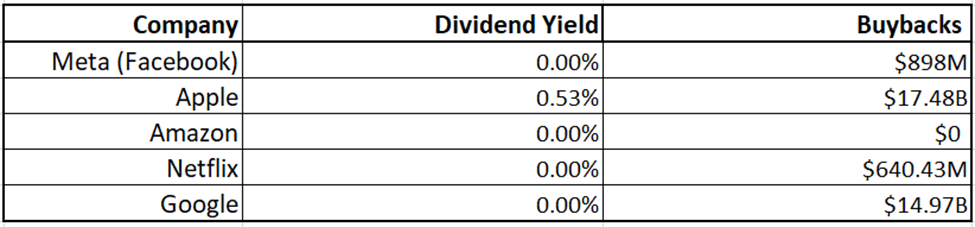
Dividend policy
Of all the companies in the FAANG sector, only Apple pays dividends. The rest of the companies refrain from dividend payments but carry out buybacks of their own shares.
FAANG Debt Ratio.
The dividend yield on Apple stock is very low, which is typical for growth companies.
Key multipliers of the FAANG sector
For the first half of this year, companies have significantly increased capitalization. This was the result of an active program of buybacks and AI hype. Capitalization growth led to a significant increase in the company's price multipliers.
P/E of almost all companies in the sector significantly exceeds the median value in the industry. Currently, Alphabet is not outperforming its industry in terms of P/E.
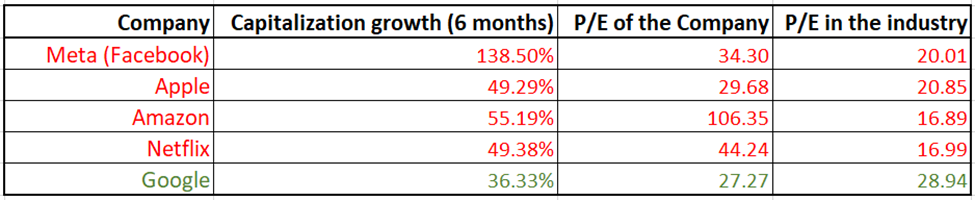
FAANG P/E Comparison
Valuation of companies and determination of the fair value of shares
A Discounted Cash Flow Model (DCF) was built for each company. According to the models, Apple and Amazon are overvalued – the current share price exceeds the fair estimate.
Even though the fair value of Netflix's shares turned out to be $906.98, the degree of confidence in the constructed model is quite low – many assumptions were made.
Meta and Google have been undervalued. The upside potential for Meta shares is about 55%, and for Google – about 27.6%.
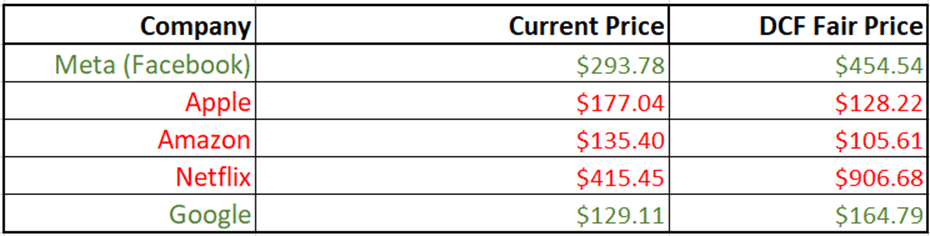
FAANG DCF Fair Price
Comments are closed.