Exxon Mobil (XOM) looking to end five waves Elliott Wave impulse [Video]
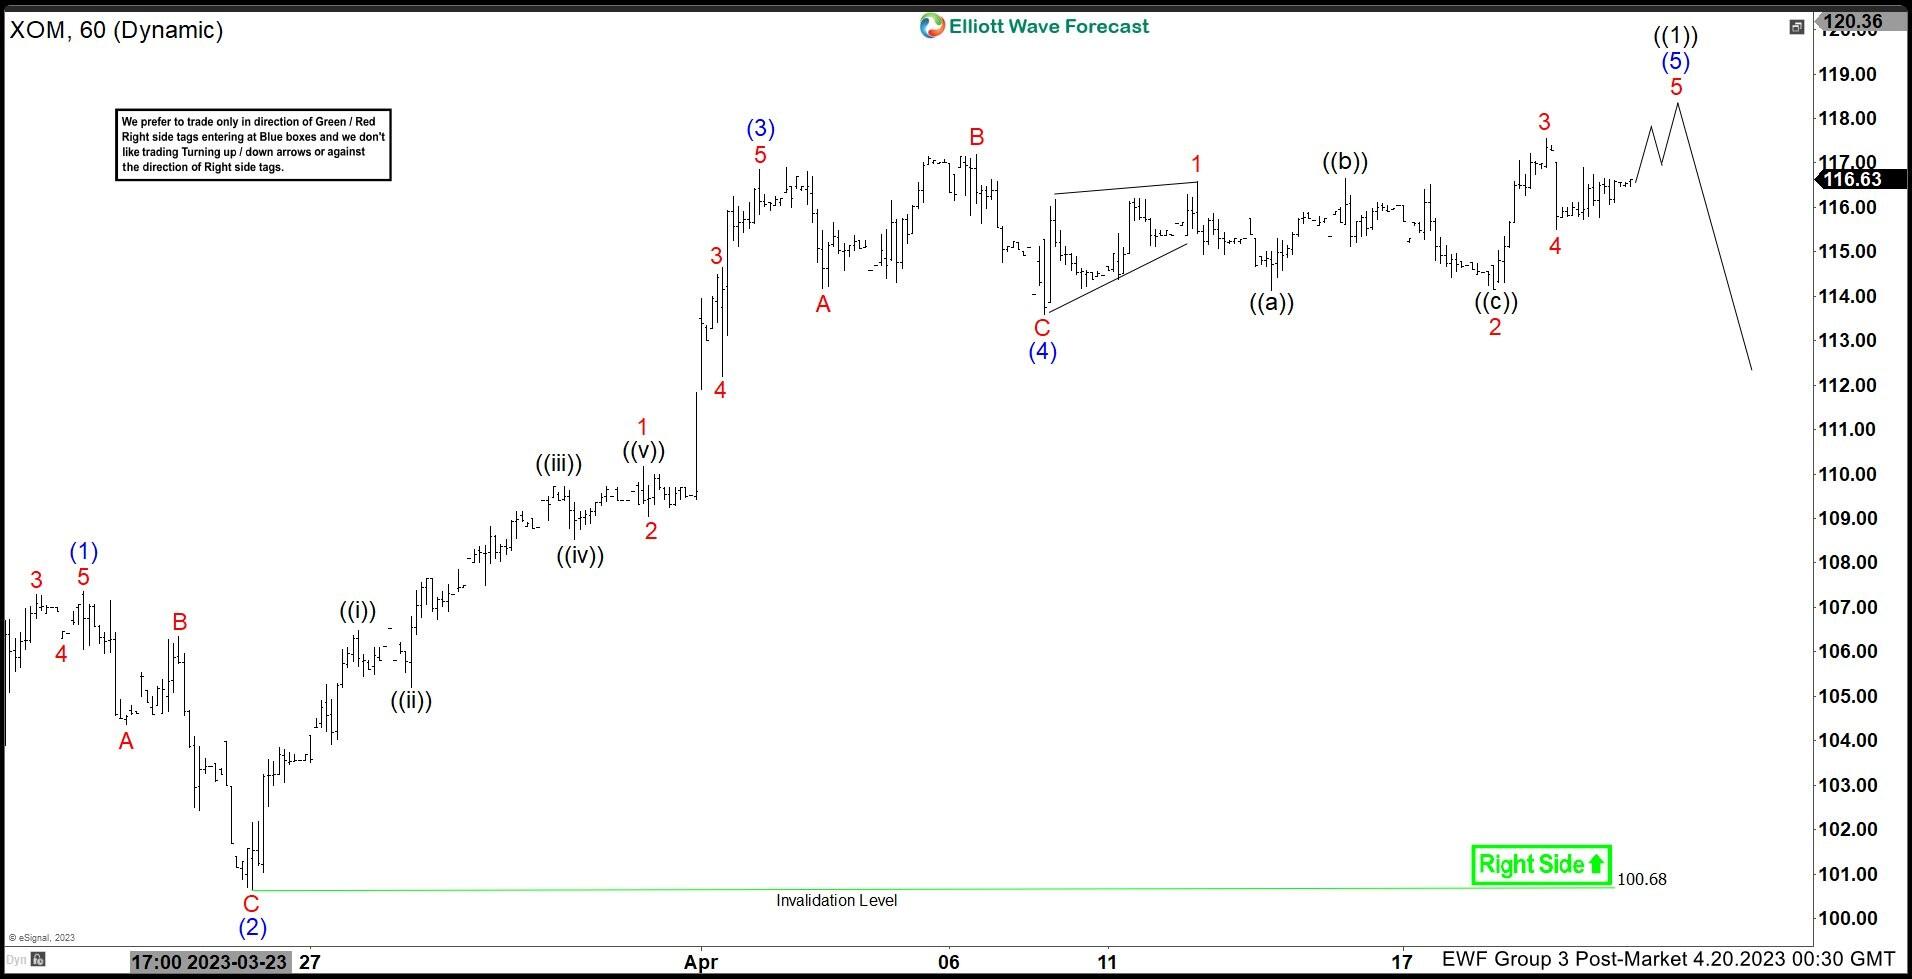
Exxon Mobil (XOM) cycle from 3.20.2023 low is in progress as a 5 waves impulse Elliott Wave structure. Up from 3.20.2023 low, wave (1) ended at 107.35 and pullback in wave 2 ended at 100.68 as the 1-hour chart below shows. Up from there, wave 1 ended at 110.17 and wave 2 ended at 109.05. Wave 3 ended at 114.64, wave 4 ended at 112.20. Final wave 5 ended at 116.85 which completed wave (3) in higher degree.
Wave (4) pullback took the form of a zigzag Elliott Wave structure. Down from wave (3), wave A ended at 114.17, and wave B ended at 117.18. Wave C lower ended at 113.6 which completed wave (4). Wave (5) is in progress as a 5 waves diagonal structure. Up from wave (4), wave 1 ended at 116.59 and pullback in wave 2 ended at 114.16. Wave 3 ended at 117.56 and dips in wave 4 ended at 115.50. Near term, expect XOM to extend higher to complete wave 5 of (5) of ((1)) before cycle from 3.20.2023 low ends and the stock see a larger degree pullback. As far as pivot at 100.68 low stays intact, expect the stock to extend the final leg higher before ending cycle from 3.20.2023 low.
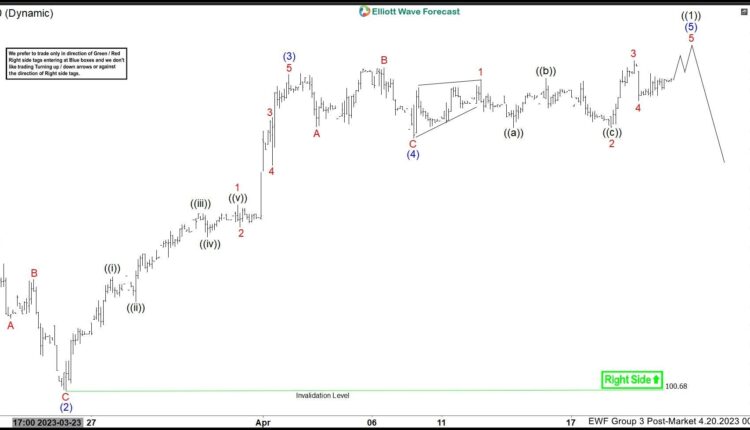
XOM 60 minute Elliott Wave chart

XOM Elliott Wave video


Comments are closed.