

Euro, EUR/USD, US Dollar, EUR/JPY, Japanese Yen, EUR/CHF, Swiss Franc, Trend, Range – Talking Points
- Euro bulls have been cheering against the US Dollar this week after a rally
- A plunge in EUR/JPY last week proved to be unsustainable with a solid bounce
- EUR/CHF looks to be in the range for now. Will EUR/CHF break out?
Recommended by Daniel McCarthy
Get Your Free EUR Forecast
EUR/USD TECHNICAL ANALYSIS
EUR/USD jumped higher again overnight as it continues to rally off the eleven-month low seen last week at 1.0448.
The peak seen overnight was unable to overcome a breakpoint and prior high near 1.0520 and it may continue to offer resistance ahead of a descending trend line.
Further up, resistance could be at another prior peak at 1.0673 which coincides with the 34-day simple moving average (SMA). Similarly, resistance might be near 1.0770 where there is a recent high and the 55-day SMA.
Above those levels, the 100- and 200-day SMAs may offer resistance near the breakpoint at 1.0830.
Despite the recent run-up, EUR/USD remains in a descending trend channel and with the price below these medium and longer-term SMAs, overall bearish momentum could be intact until these SMAs have been vanquished.
On the downside, support might lie near the breakpoints and lows of early 2023 that were tested recently with 1.0480 and 1.0440 as potential levels of note.
EUR/USD DAILY CHART
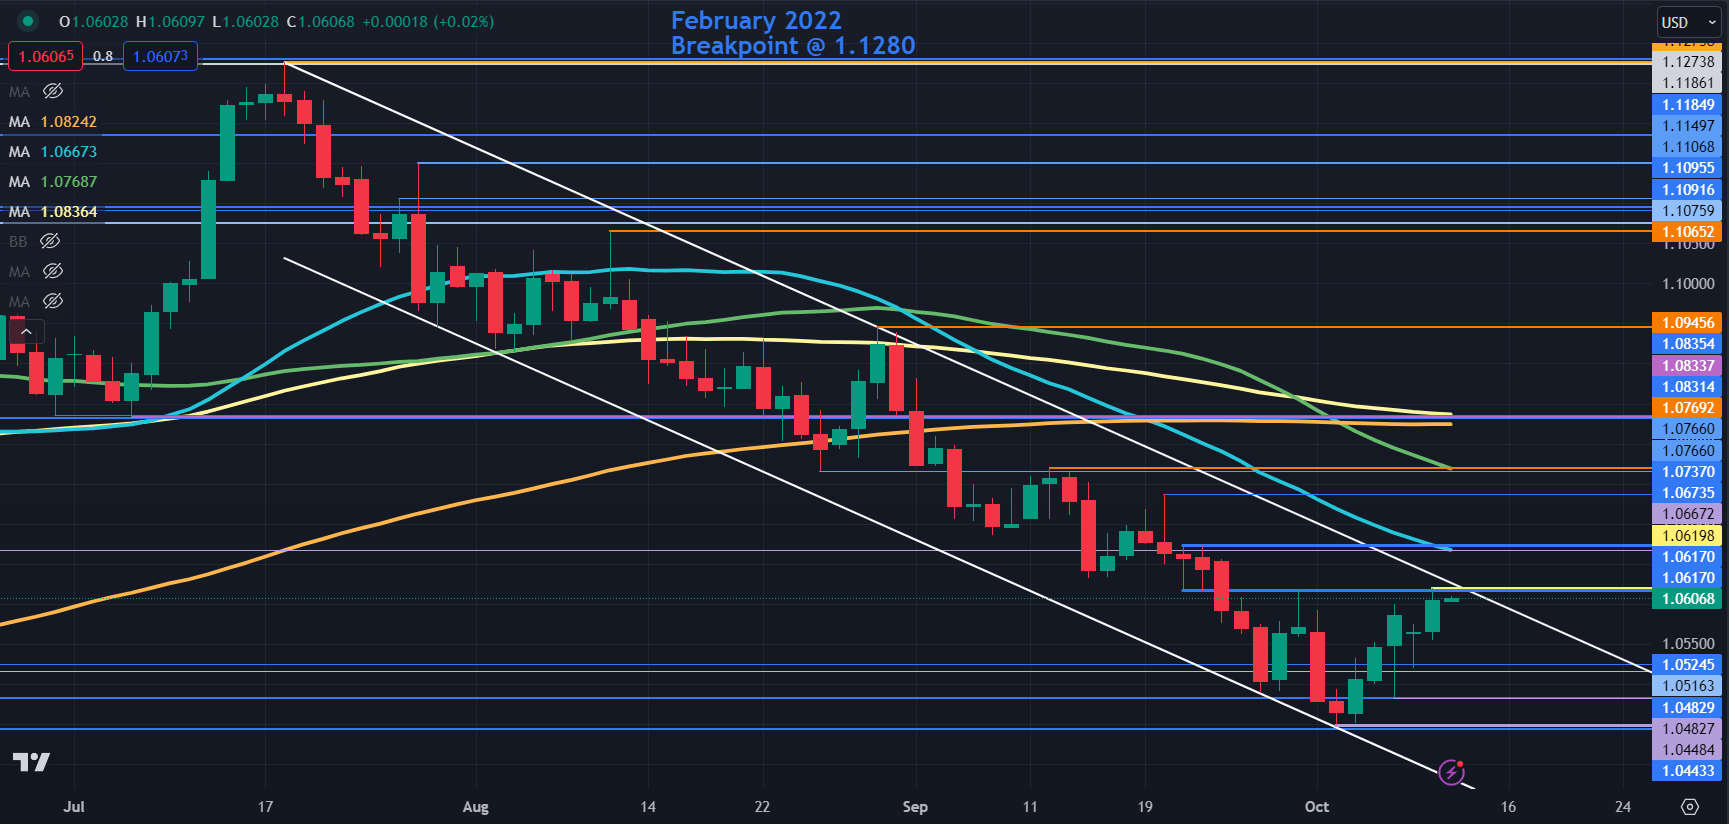
Chart Created in TradingView
EUR/JPY TECHNICAL ANALYSIS
EUR/JPY appears to have rejected the move lower of last week when it traded down to a three-month low of 154.39.
That dip broke below the September low and the 55-day Simple Moving Average (SMA) before closing back above all of them in the proceeding sessions.
The sell-off also broke below the lower band of the 21-day simple moving average (SMA) based Bollinger Band. After closing back inside the band, a run higher ensued and the price has since consolidated back within the range.
A feature of Bollinger Bands is to easily identify the level of volatility in the market by the width of the bands.
The current relative narrowness of the bands and the rejection of the move lower might suggest that there is a lack of directional conviction for EUR/JPY for now.
This may provide opportunities for range trading strategies. To learn more about range trading, click on the banner below.
Recommended by Daniel McCarthy
The Fundamentals of Range Trading
Support could be at the breakpoint and a recent low toward 156.50. On a sustained move lower, the levels to watch might be at the previous lows and breakpoints of 154.39, 153.45, 151.60, 151.40 and 151.07.
On the top side, the recent highs of 158.65 and 159.76 may offer resistance.
EUR/JPY DAILY CHART
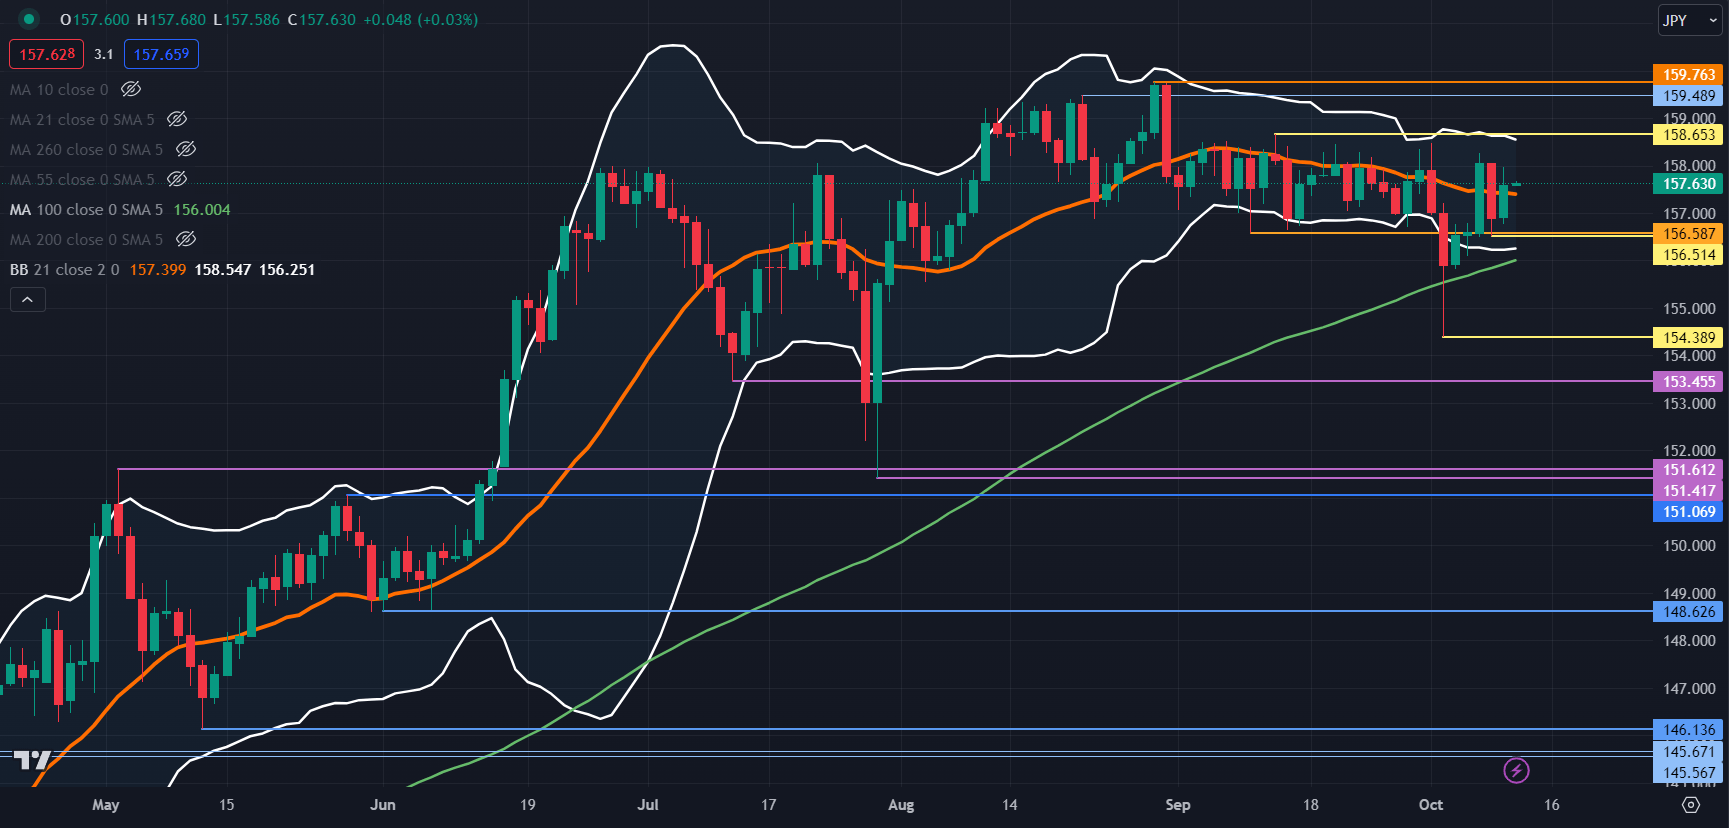
Chart Created in TradingView
EUR/CHF TECHNICAL ANALYSIS
EUR/CHF has been contained and trading between 0.9500 and 0.9700 for 3 months in what appears to be a range trading environment. This seems to be a characteristic of EUR/CHF from time to time.
The 10-, 21-, 34-, 55- and 100-day SMAs are all grouped together within this range, which may confirm a lack of direction for EUR/CHF, not too dissimilar to EUR/JPY above.
If either side of that range is penetrated, a breakout trade opportunity may evolve. To learn more about breakout trading, click on the banner below.
Recommended by Daniel McCarthy
The Fundamentals of Breakout Trading
Support might be at an ascending trendline, currently near 0.9535 ahead of the previous lows at 0.9516 and 0.9408.
On the upside, resistance could be at the 100-day SMA which is currently near 0.9650, ahead of the prior peak and breakpoints at 0.9694, 0.9706 and 0.9723.
EUR/CHF DAILY CHART
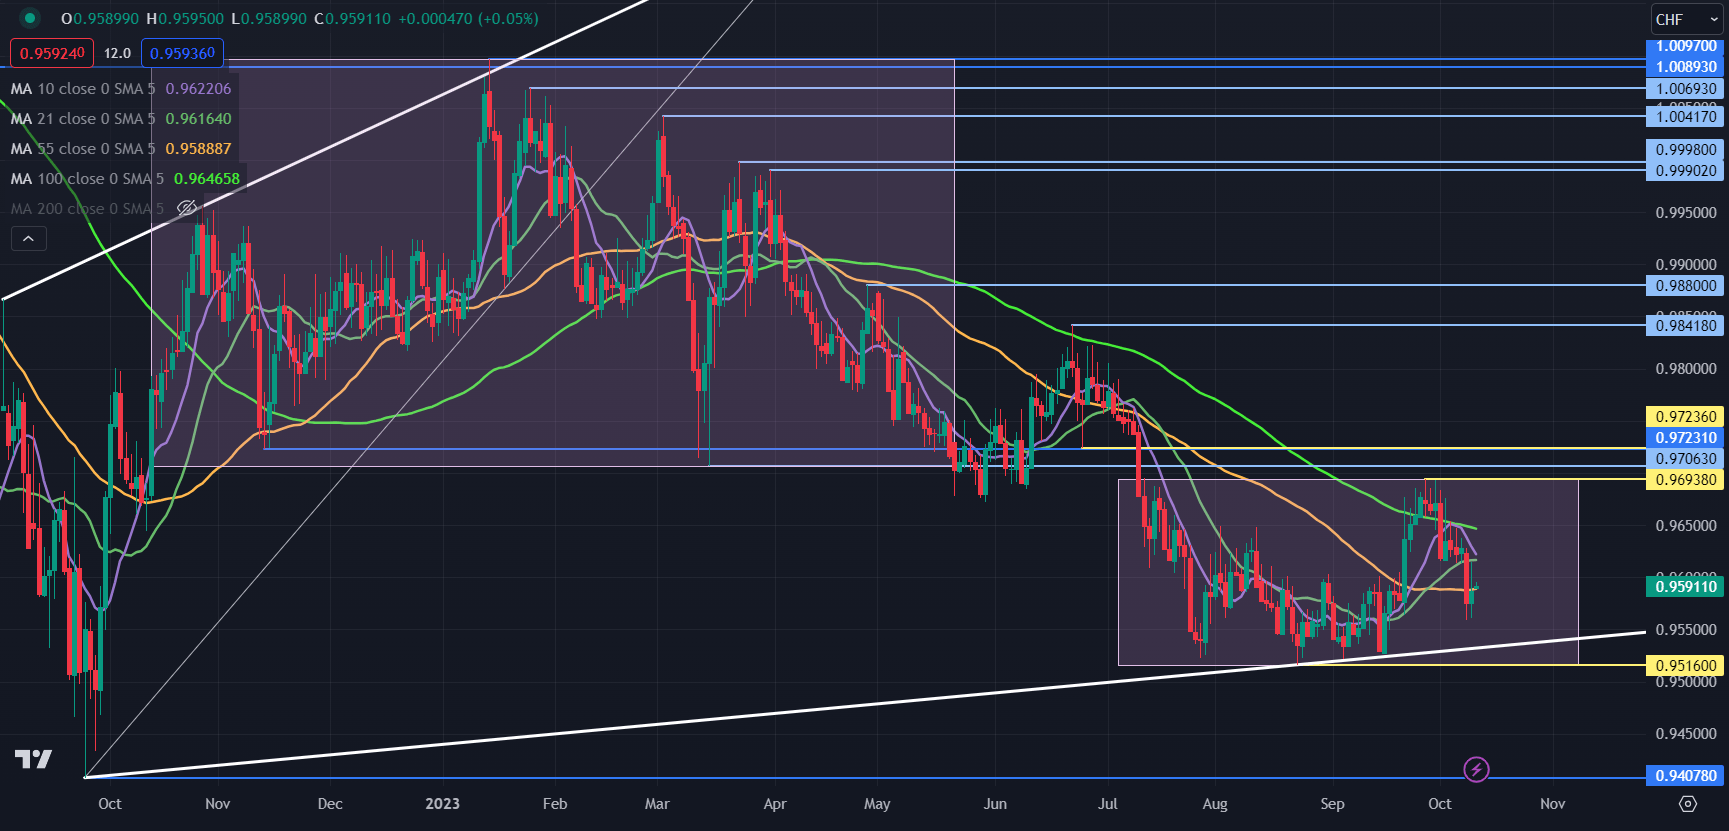
Chart Created in TradingView
— Written by Daniel McCarthy, Strategist for DailyFX.com
To contact Daniel, use the comments section below or @DanMcCathyFX on Twitter
Comments are closed.