Euro Technical Outlook – Trend Break Might be Short Lived for EUR/USD
Euro, EUR/USD, US Dollar, Trend Breakout, Candlestick, Bollinger Band – Talking Points
- Euro bulls were rewarded earlier this week before a pullback surfaced
- The technical set-up from the recent rally might see Euro bears re-enter the fray
- The squeeze higher appears to have been rejected for now. Will EUR/USD go lower?
Recommended by Daniel McCarthy
Get Your Free EUR Forecast
EUR/USD TECHNICAL ANALYSIS
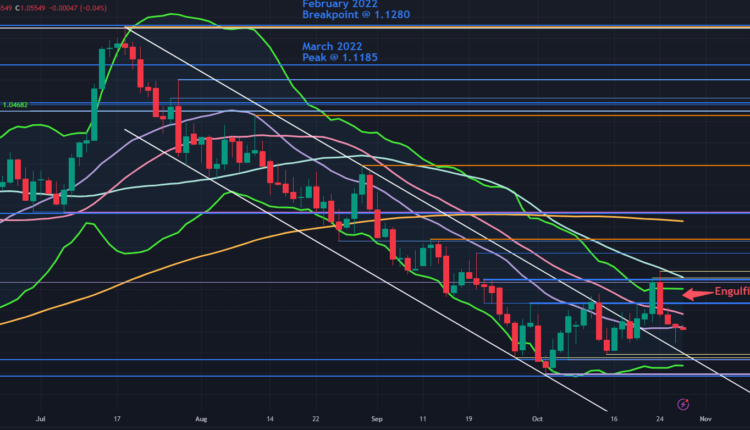
EUR/USD cleanly broke through the topside of a descending trend channel last week and continued higher to briefly pierce minor resistance levels near 1.0680 to make a high at 1.0695.
The price action on the day that the price made that high saw a Bearish Engulfing Candlestick
formation emerged and it has gone lower in the proceeding days.
A Bearish Engulfing Candlestick opens at, or above the previous candle’s close. The length of the bearish candle ‘engulfs’ the previous green candle and it then closes below the prior candle’s open.
This reversal might signal that the descending trend may re-emerge.
The recent rally broke above the upper band of the 21-day simple moving average (SMA) based Bollinger Band. On the same day that Engulfing Candlestick materialised, the price closed back inside the band.
This potentially adds weight to the perspective that a reversal could be in play.
A bearish triple moving average (TMA) formation requires the price to be below the short-term SMA, the latter to be below the medium-term SMA and the medium-term SMA to be below the long-term SMA. All SMAs also need to have a negative gradient.
When looking at any combination of the 21-, 34-, 55- and 100-day SMAs, the criteria for a TMA have been met and might suggest that bearish momentum is evolving.
To learn more about trend trading, click through on the banner just below.
Recommended by Daniel McCarthy
The Fundamentals of Trend Trading
On the downside, nearby support might lie near the previous lows and breakpoints in the 1.0480 – 1.0495 area ahead of the lows seen in December 2022 and October 2023 near 1.0445.
On the topside, the 55-day SMA is currently near the recent peak and there might be a resistance zone ahead of 1.0700.
The next resistance levels could be at the breakpoints and previous highs near 1.0740, 1.0770, 1.0835 and 1.0945 ahead of a cluster zone of potential resistance in the 1.1075 – 1.1100 area.
EUR/USD DAILY CHART
Chart Created in TradingView
Trade Smarter – Sign up for the DailyFX Newsletter
Receive timely and compelling market commentary from the DailyFX team
Subscribe to Newsletter
— Written by Daniel McCarthy, Strategist for DailyFX.com
To contact Daniel, use the comments section below or @DanMcCathyFX on Twitter


Comments are closed.