Euro Technical Outlook – Ranges Against Trends. Is EUR/USD Trapped?
Euro, EUR/USD, US Dollar, Fibonacci, Range, Momentum, Trend – Talking points
- The Euro rally fizzled last week, but the pullback has been shallow so far
- The ascending trend seems intact for now, but crucial levels are nearby
- There are bullish and bearish perspectives for EUR/USD. Which will prevail?
Recommended by Daniel McCarthy
How to Trade EUR/USD
EUR/USD TECHNICAL ANALYSIS
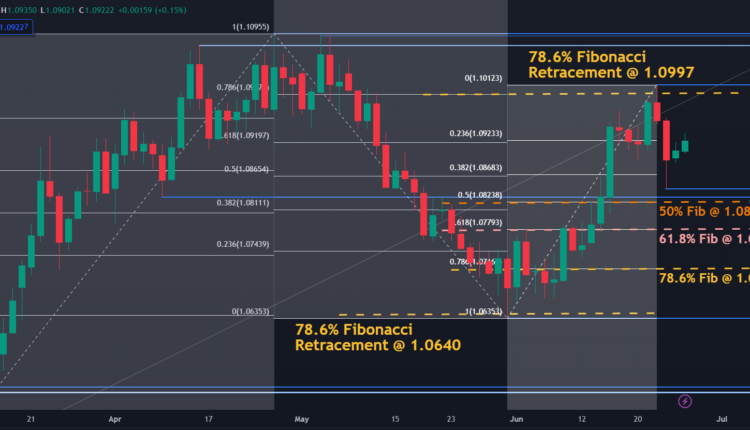
EUR/USD remains in the six-week range of 1.0516 – 1.1096 after failing to meaningfully challenge the topside last week.
The run higher barely eclipsed the 78.6% Fibonacci Retracement of the move from 1.1096 down to 1.0635 at 1.0997 when it peaked at 1.1012. Those levels may continue to offer resistance ahead of a series of potential resistance levels in the 1.1076 – 1.1096 area.
Nearby support could be at the recent low of 1.0844, which is just above the breakpoint of 1.0831.
Further to the downside, there are a series of Fibonacci Retracement levels of the move from 1.0635 up to 1.1012 that might provide support. The 50% Retracement level is at 1.0824, the 61.8% at 1.0779 and 78.6% is at 1.0716.
The late May low of 1.0635 was only a fraction below the 78.6% Fibonacci Retracement of the move from 1.0516 to 1.1096 at 1.0640. This could make the 1.0635-40 area a possible support zone ahead of the prior lows at 1.0525, 1.0516, 1.0483 and 1.0443.
EUR/USD DAILY CHART OVER THE LAST 3 MONTHS
Chart Created in TradingView
While the chart above highlights the range trading nature for EUR/USD of late, if we zoom out on the timeframe, the currency pair remains in an ascending trend.
However, the price might be at a somewhat critical juncture over the coming weeks. A failure to take out the March 2022 peak of 1.1185 may infer that a longer-term Double Top could be in play.
A clean break above 1.1185 might imply that the ascending trend is intact and could see further bullishness evolve.
On the downside, a break below the ascending trend line could confirm the Double Top. Such a move may see bearishness unfold.
The price is above the 21-, 34-, 55-, 100-, 200- and 260-day simple moving averages (SMA) but is oscillating around the 10-day SMA. A reacceleration above the 10-day SMA might suggest that bullish momentum could evolve further.
Recommended by Daniel McCarthy
The Fundamentals of Trend Trading
EUR/USD DAILY CHART OVER THE LAST 8 MONTHS

Chart Created in TradingView
— Written by Daniel McCarthy, Strategist for DailyFX.com
To contact Daniel, use the comments section below or @DanMcCathyFX on Twitter


Comments are closed.