Euro Technical Outlook – Different Set-Ups for EUR/USD and EUR/JPY
Euro, EUR/USD, US Dollar, EUR/JPY, Japanese Yen, Trend, Fibonacci, Momentum – Talking points
- Euro bearishness appears to have stalled against the US Dollar
- The trend in EUR/USD could face scrutiny in the next few sessions
- EUR/JPY is eyeing 158. If it breaks above there, will further bullishness unfold?
Recommended by Daniel McCarthy
How to Trade FX with Your Stock Trading Strategy
EUR/USD TECHNICAL ANALYSIS
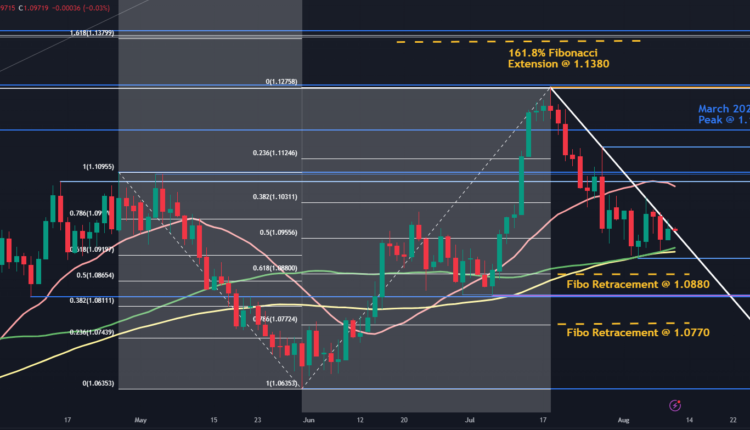
EUR/USD has been testing a descending trend line in the last few sessions, but it is just holding on for now as it continues to trade in a range this week.
Being below the trend line may suggest that near-term bearishness is intact for now, but a close above it could suggest a pause in the trend.
If it was to break above that trend line, it may see a test of potential resistance in the 1.1075 – 1.1095 area where several historical breakpoints reside along with the 21-day simple moving average (SMA) and just ahead of the psychological level at 1.1100.
Further up, resistance could be at the breakpoint from the March 2022 high at 1.1185 or the recent peak at 1.1275, which coincides with two historical breakpoints.
Above those levels, resistance might be at the Fibonacci Extension of the move from 1.1095 to 1.0635 at 1.1380. Just above there are some more breakpoints in the 1.1385 – 95 area.
On the downside, support may lie near the recent low at 1.1010. Just above there the 55- and 100-day SMAs are near 1.1030 and may lend support.
Support could also be near the 61.8% and 78.6% Fibonacci Retracement levels at 1.0880 and 1.0770 respectively.
Between those Fibonacci levels, some prior lows and the breakpoint in the 10830- 1.0835 area may provide support.
Recommended by Daniel McCarthy
How to Trade EUR/USD
EUR/USD DAILY CHART
Chart Created in TradingView
EUR/JPY TECHNICAL ANALYSIS
EUR/JPY is within striking distance of last month’s peak at 158.05, which was the highest level seen since September 2008. A month that rattled markets with the onset of the global financial crisis.
EUR/JPY remains within an ascending channel and the bullish trend might be intact for now. To learn more about trend trading, click on the banner below.
Recommended by Daniel McCarthy
The Fundamentals of Trend Trading
A bullish triple moving average (TMA) formation requires the price to be above the short-term simple moving average (SMA), the latter to be above the medium-term SMA and the medium-term SMA to be above the long-term SMA. All SMAs also need to have a positive gradient.
Looking at the 10-, 21-, 55-, 100- and 200-day SMAs, any combination of these will meet the criteria for a TMA, which could suggest that bullish momentum is evolving.
Support may lie at the breakpoint at 153.45 which is near the ascending trend line. A break below there might imply that the bullish run could be ending.
Below there, the 151.40 – 151.60 is a potential support zone with a breakpoint and a prior in the vicinity.
EUR/JPY DAILY CHART

Chart Created in TradingView
— Written by Daniel McCarthy, Strategist for DailyFX.com
To contact Daniel, use the comments section below or @DanMcCathyFX on Twitter


Comments are closed.