EUR/USD holds key support ahead of Euro area CPI
US Dollar, Euro, EUR/USD – Outlook:
- EUR/USD is approaching a fairly strong support.
- Key focus on US ISM and Euro area CPI data this week.
- What is the outlook and what are the key signposts to watch?
Recommended by Manish Jaradi
How to Trade EUR/USD
The euro’s rebound against the US dollar on Monday from near-strong support could be a sign that the single currency isn’t ripe to break lower ahead of the key Euro area CPI data due later this week.
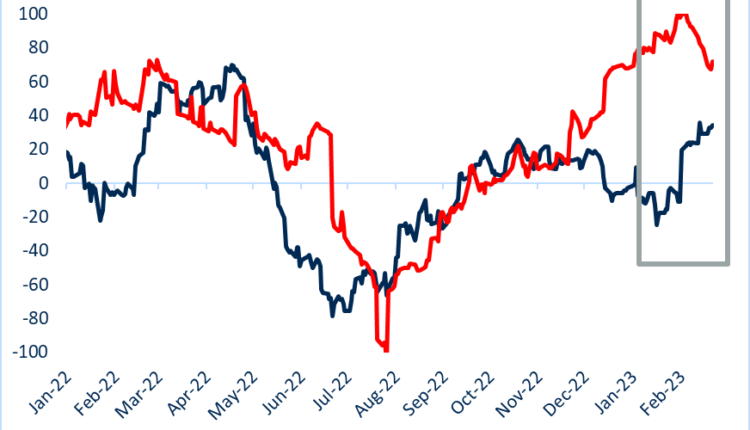
From a macro perspective, the story by and large so far this month has been surprisingly strong US data, as reflected in the jump in the US Economic Surprise Index to a 10-month high (see Economic Surprise Index chart). US Rate futures are now pricing in the Fed’s target rate to peak around 5.40% in September from the current 4.50-4.75%, compared with under 5% at the end of January.Key focus is now on US ISM Manufacturing and Services PMI data due Wednesday and Friday respectively.
Economic Surprise Index Chart
Chart Created by Manish Jaradi; Source data: Bloomberg
In comparison, Euro area data have been less upbeat – the Economic Surprise Index is still in positive territory but retreated since the beginning of February. This week, preliminary February CPI inflation data from Germany (Wednesday) and the Euro area (Thursday) will be closely watched. Ahead of the data, long-term euro zone expectations rose to a new 10-month high on Monday. So far, headline Euro area inflation is easing, but core inflation remains sticky. Rate futures are pricing in around 150 basis points of ECB rate hikes by September, largely unchanged from early February.
EUR/USD Daily Chart

Chart Created Using TradingView
On technical charts, EUR/USD posted a bullish engulfing pattern on the daily candlestick charts on Monday as it nears a fairly strong cushion at the January low of 1.0480, also the price objective of a minor double top (the February 9 and February 14 highs). See “EUR/USD Price Setup: A Bit More Downside Within a Broader Consolidation?”, published February 20.
This support is crucial as any break below could open the way toward the 200-day moving average (now at 1.0330). Importantly, such a break would disrupt the higher-top-higher-bottom pattern since September, that is, a risk to the five-month-long uptrend.
EUR/USD 4-Hour Chart
Chart Created Using TradingView
On the other hand, if Monday’s jump is a sign that EUR/USD is searching for a bottom ahead of the inflation data, then the pair needs to break above the immediate ceiling at 1.0625. Such a break would be an early sign that the single currency is in the process of building a base. A strong signal would be a break above the 89-period moving average, around the upper edge of the Ichimoku cloud. A stronger-than-expected CPI print could provide a boost to EUR/USD.
Trade Smarter – Sign up for the DailyFX Newsletter
Receive timely and compelling market commentary from the DailyFX team
Subscribe to Newsletter
— Written by Manish Jaradi, Strategist for DailyFX.com


Comments are closed.