EUR/USD Defies Support After Pullback, USD/JPY Stands Tall
EUR/USD AND USD/JPY FORECAST
- EUR/USD slides and tests an important technical support in the 1.0695/1.0670 area
- USD/JPY extends its recovery for the second straight day, coming within striking distance from overtaking overhead resistance
- This article analyzes key price levels to watch in the coming trading sessions
Trade Smarter – Sign up for the DailyFX Newsletter
Receive timely and compelling market commentary from the DailyFX team
Subscribe to Newsletter
Most Read: EUR/USD, GBP/USD and AUD/USD Muted as Bullish Momentum Wanes
The U.S. dollar, as measured by the DXY index, was slightly firmer on Tuesday, extending gains for a second straight day after last week's excessive pullback, despite the retrenchment in U.S. yields. The move in the broader U.S. dollar weighed on EUR/USD, driving the pair toward an important support region near 1.0670. Meanwhile, USD/JPY managed to trek upwards, consolidating above the 150.00 mark and approaching technical resistance at 150.90.
This article focuses on the EUR/USD and USD/JPY from a technical standpoint, examining critical price levels that traders need to keep an eye on and, perhaps, incorporate into their trading strategies in the coming sessions.
For a complete overview of the euro’s technical and fundamental outlook, download your complimentary Q4 trading forecast now!
Recommended by Diego Colman
Get Your Free EUR Forecast
EUR/USD TECHNICAL ANALYSIS
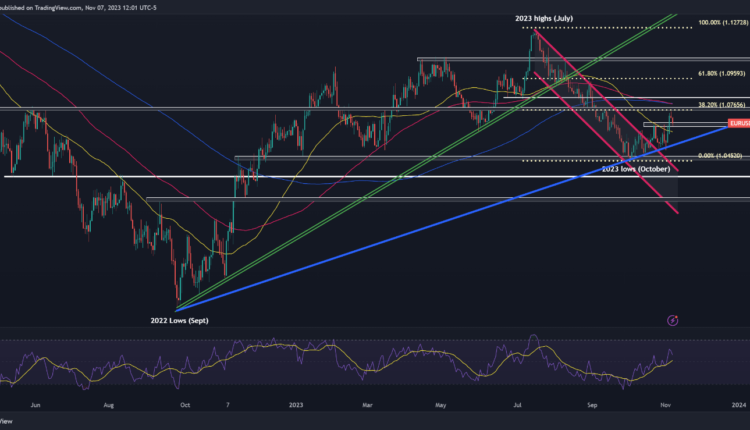
EUR/USD soared to its best level in nearly two months last week following soft U.S. labor market data and cautious commentary from the Federal Reserve chief. Bullish impetus, however, has started to wane over the past couple of days, with the pair retracing recent gains and now challenging support in the 1.0695/1.0670 area.
With volatility poised to increase due to the numerous risk events on the calendar later this week, including speeches by Fed Chair Powell and ECB President Lagarde, we could see more pronounced swings in the exchange rate. That said, there are two potential scenarios that could unfold that are worth highlighting.
Scenario one: EUR/USD breaks below 1.0695/1.0670 on daily closing prices. If this scenario materializes, selling pressure could gather pace, laying the groundwork for a potential challenge of trendline support at 1.0555. A violation of this technical floor could embolden the bears to initiate an assault on this year’s lows near 1.0450.
Scenario two: Prices rebound from current levels. If the bullish camp mounts a resurgence from horizontal support at 1.0695/1.0670, we could see a move towards 1.0765, the 38.2% Fibonacci retracement of the July/October selloff. Upside clearance of this barrier could open the door for a climb towards 1.0840.
Keen to understand the role of retail positioning in EUR/USD's price action dynamics? Our sentiment guide delivers all the essential insights. Get your free copy now!
| Change in | Longs | Shorts | OI |
| Daily | 16% | -20% | -4% |
| Weekly | -20% | 32% | -3% |
EUR/USD TECHNICAL CHART
EUR/USD Chart Created Using TradingView
Gain insights into the Japanese yen's fundamentals and technicals by downloading our free Q4 trading forecast today.
Recommended by Diego Colman
Get Your Free JPY Forecast
USD/JPY TECHNICAL ANALYSIS
USD/JPY extended its recovery on Tuesday, rising for a second consecutive day and decisively consolidating above the psychological 150.00 level after weak Japanese wage growth data reduced the likelihood of near-term monetary policy normalization by the Bank of Japan.
If USD/JPY’s gains accelerate in the coming trading sessions, technical resistance is positioned at 150.90, followed by the 2023 swing high near the 151.00 mark. On further strength, the focus transitions to 153.00, which corresponds to the upper boundary of a rising channel in play since March.
Conversely, if market sentiment shifts in favor of sellers and weakness ensures, initial support is located around the 149.00 handle, just around the 50-day simple moving average. Prices may establish a foothold in this region on a pullback, but in case of a breakdown, we could observe a descent towards 147.25 and 146.00 thereafter. Further beneath these levels, attention turns to the area around 144.50.
USD/JPY TECHNICAL CHART

USD/JPY Chart Created Using TradingView


Comments are closed.