EUR/USD Confronts Trendline Resistance, Threatens Breakout After Hot German CPI
EUR/USD OUTLOOK:
- EUR/USD rallies after German inflation numbers surprise to the upside
- Broad-based U.S. dollar weakness and risk-on sentiment also boost the euro
- This article looks at key technical levels to keep an eye on in the near term
Recommended by Diego Colman
Get Your Free EUR Forecast
Most Read: USD/CAD at Risk of Breakdown as Oil Gains, Canadian Dollar Outlook Bullish for Now
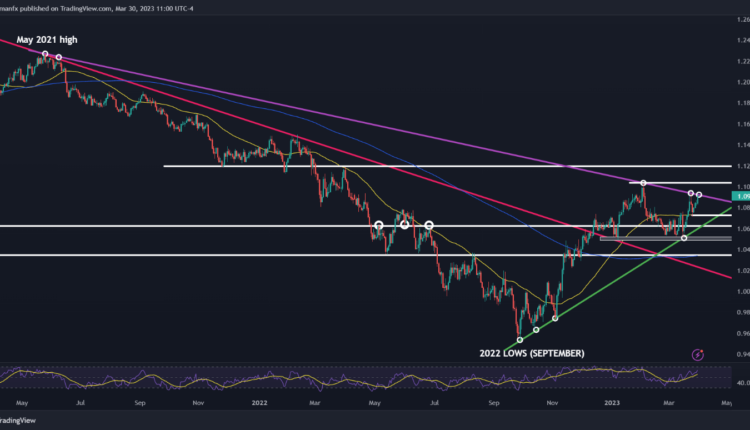
EUR/USD rallied on Thursday, boosted by risk-on sentiment, broad-based U.S. dollar weakness and hotter-than-expected inflation data in Germany. Before noon in New York, the pair was up about 0.6% and trading slightly above the psychological 1.0900 level, threatening to recapture this month’s high and on the verge of overtaking a pivotal trendline resistance.
German bond yields moved sharply higher after March CPI surprised to the upside, clocking in at 0.8% m-o-m and 7.4% y-o-y, one-tenth of a percent above consensus estimates in both cases. Sticky price pressures in the region’s largest economy may give the ECB more ammunition to continue tightening policy forcefully, paving the way for the terminal rate to adjust upwards.
With the European Central Bank expected to raise borrowing costs a few more times in the coming months, in a period when the FOMC is likely to remain on hold given the recent turmoil in the US banking sector, there is scope for the euro to strengthen further against the U.S. dollar. However, monetary policy divergence will provide moderate support for the common currency. There are other variables at play.
| Change in | Longs | Shorts | OI |
| Daily | 13% | -15% | -5% |
| Weekly | -5% | 18% | 8% |
EUR/USD TECHNICAL ANALYSIS
After this week’s climb, EUR/USD is currently facing a pivotal hurdle at 1.0930: a descending trendline in play since May 2021 that has acted as resistance multiple times over its lifespan. Price reaction at this technical juncture will be key, with a topside breakout setting the stage for a retest of the 2023 highs at 1.1033. On further strength, the focus shifts to the psychological 1.1200 handle.
On the flip side, if sellers manage to regain control of the market and trigger a bearish reversal from current levels, initial support rests at 1.0730, near the 50-day simple moving average as shown in the chart included in this article. Below this area, the next floor of interest, which lies around 1.0620, corresponds to a short-term rising trendline extended of the September 2022 lows.
Recommended by Diego Colman
How to Trade EUR/USD
EUR/USD TECHNICAL CHART
EUR/USD Chart Prepared Using TradingView


Comments are closed.