
The tech-heavy NASDAQ 100 took hits from weak U.S. reports yesterday!
Will the stock index find enough buyers to extend its uptrend in the next trading sessions?
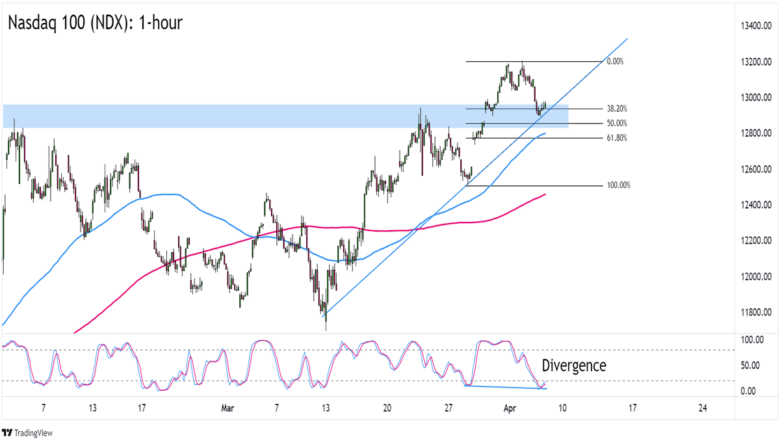
Nasdaq 100 (NDX): 1-hour

Nasdaq 100 (NDX) 1-hour Chart by TradingView
In case you missed it, closely-watched U.S. reports like the ADP release and the ISM services PMI survey pointed to a weakening labor market.
Bad news for the U.S. economy that depends heavily on consumer activity for growth.
The NASDAQ 100 stock index, which is populated by a lot of tech companies that have already laid off employees, closed lower on recession concerns.
NDX found resistance at the 13,205 area and is now trading closer to the 12,960 zone.
Will the stock index regain its mojo?
On a technical basis, NDX has room to rise as it’s still supported by a trend line that hasn’t been broken since mid-March.
Meanwhile, the 100 and 200 SMAs continue to point upwards with the 100 SMA hanging out just below the curreny prices.
And then there’s the bullish divergence on the 1-hour time frame which could help push NDX back to its previous highs.
NASDAQ’s next direction will likely depend on today’s initial jobless claims and NFP speculations (and/or release).
If traders choose to focus on recession fears, then risk aversion could extend NDX’s downswing and break its technical support levels.
But if weak economic reports or this week’s NFP numbers highlights the possibility of the Fed pausing its tightening program, then NDX can extend its uptrend and maybe make new weekly highs before seeing another downswing.
This content is strictly for informational purposes only and does not constitute as investment advice. Trading any financial market involves risk. Please read our Risk Disclosure to make sure you understand the risks involved.
Comments are closed.