Equities Watchlist: FTSE 100 Index (UK100) Wedge Breakout Looming?
Waiting for a big move in the equity markets these days?
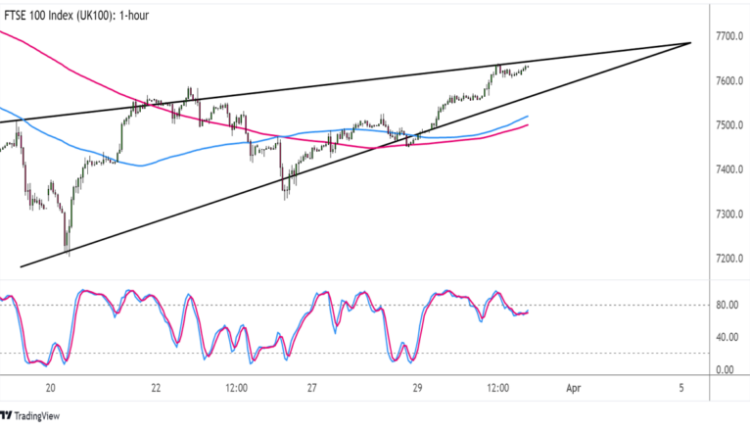
Take a look at this FTSE 100 wedge consolidation pattern that might be ready for a breakout soon!

FTSE 100 (UK100) 1-hour Chart by TradingView
I’m seeing tighter consolidation on this rising wedge formation!
This means that a breakout is bound to happen soon for the FTSE 100 stock index. But which way might it go?
Moving averages are pointing to a potential upside move, as the 100 SMA is still above the 200 SMA to reflect the presence of bullish vibes.
If that’s the case, the equity index could be in for a rally that’s the same height as the chart pattern as soon as it busts through the 7,700 barrier.
However, Stochastic has been hanging out near the overbought region for quite some time and looks ready to turn south. Price could follow suit as bearish pressure picks up, possibly dipping back to support around 7,600 or attempting a break lower.
So far, it looks like market sentiment is pointing in favor of a bullish breakout, as the lack of fresh banking sector woes is encouraging investors to put money back in riskier holdings like equities.
Besides, U.K. policymakers have assured that their financial sector remains liquid and robust, so renewed confidence in the stock market could be enough to keep the index supported in the near-term.
This content is strictly for informational purposes only and does not constitute as investment advice. Trading any financial market involves risk. Please read our Risk Disclosure to make sure you understand the risks involved.


Comments are closed.