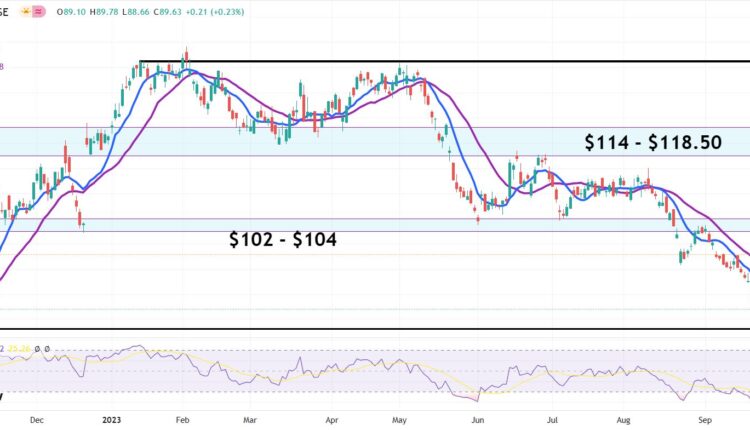
Earnings beat triggers NKE to surpass 21-day moving average
- Nike beat earnings consensus for FQ1 results.
- The quarter ending in August witnessed better pricing power.
- Nike earned $0.94 per share on revenue of $12.94 billion.
- NKE stock has conquered the 21-day SMA, signaling a new uptrend.
Nike (NKE) stock has surged over 9% in Friday’s premarket, climbing above $98 per share, following late Thursday’s fiscal first-quarter earnings release. Nike beat pessimistic earnings expectations by more than 23% and hiked its dividend by 9%.
The entire market is making gains before the bell as the NASDAQ 100 futures rise 0.6% and the S&P 500 and Dow futures both advance above 0.3%. Nike’s positive outlook has aided trader enthusiasm, but many observers also expect Core Personal Consumption Expenditures data to show declining inflation.
Nike earnings news: Nike still has pricing power
Oregon-based Nike reported $0.94 in GAAP earnings per share (EPS) on revenue of $12.94 billion. The market ignored that the footwear king missed consensus on sales by over $60 million, instead viewing Nike’s 18-cent beat on EPS as a seachange event.
Nike management said they had used better pricing strategies, reduced their reliance on markdowns, and lowered inventory in an attempt to streamline the operations. A stronger US Dollar was still a problem for Nike in the quarter ending in August, but the brand benefited from lower ocean freight costs.
The revenue shortfall was primarily due to sales in Greater China that were $90 million below analyst expectations, but the region still provided double-digit sales growth YoY.
Morgan Stanley analyst Alex Straton retained his $126 price target on Nike shares and his Overweight rating. Straton said the vigor and optimism from management would seem to mean that the worst is now behind the athletic wear giant.
For the second fiscal quarter, which will be reported in December, Nike management expects single digit annual gains in sales with at least a one percentage point increase in gross margin, and CFO Matt Friend said that there would be ongoing growth in operating margin as well.
“We are building on a strong foundation for sustainable and more profitable long-term growth,” Friend said.
S&P 500 FAQs
The S&P 500 is a widely followed stock price index which measures the performance of 500 publicly owned companies, and is seen as a broad measure of the US stock market. Each company’s influence on the computation of the index is weighted based on market capitalization. This is calculated by multiplying the number of publicly traded shares of the company by the share price. The S&P 500 index has achieved impressive returns – $1.00 invested in 1970 would have yielded a return of almost $192.00 in 2022. The average annual return since its inception in 1957 has been 11.9%.
Companies are selected by committee, unlike some other indexes where they are included based on set rules. Still, they must meet certain eligibility criteria, the most important of which is market capitalization, which must be greater than or equal to $12.7 billion. Other criteria include liquidity, domicile, public float, sector, financial viability, length of time publicly traded, and representation of the industries in the economy of the United States. The nine largest companies in the index account for 27.8% of the market capitalization of the index.
There are a number of ways to trade the S&P 500. Most retail brokers and spread betting platforms allow traders to use Contracts for Difference (CFD) to place bets on the direction of the price. In addition, that can buy into Index, Mutual and Exchange Traded Funds (ETF) that track the price of the S&P 500. The most liquid of the ETFs is State Street Corporation’s SPY. The Chicago Mercantile Exchange (CME) offers futures contracts in the index and the Chicago Board of Options (CMOE) offers options as well as ETFs, inverse ETFs and leveraged ETFs.
Many different factors drive the S&P 500 but mainly it is the aggregate performance of the component companies revealed in their quarterly and annual company earnings reports. US and global macroeconomic data also contributes as it impacts on investor sentiment, which if positive drives gains. The level of interest rates, set by the Federal Reserve (Fed), also influences the S&P 500 as it affects the cost of credit, on which many corporations are heavily reliant. Therefore, inflation can be a major driver as well as other metrics which impact the Fed decisions.
Nike stock forecast
Nike stock has been in a serious downtrend since February 2 of this year. The stock was so oversold that it registered at 19.8 on the Relative Strength Index (RSI) prior to Thursday’s earnings.
In just one session though, the NKE price has now risen nearly $10 to overtake the 21-day Simple Moving Average (SMA). Expect Nike stock to rise out of the oversold conditions on the RSI next. Immediate resistance come from the $102 to $104 range that has worked as both support and resistance at different times throughout 2023.
After that, the $114 to $118.50 band will arrive next as the bulls main priority. On the way higher, traders will know that the rally is still ongoing if pullbacks only descend to the 9-day SMA. Pullbacks that test or break through the 21-day SMA will be reason enough to sell.
NKE daily chart


Comments are closed.