

Article by IG Chief Market Analyst Chris Beauchamp
Dow Jones, Nasdaq 100, CAC 40 Analysis and Charts
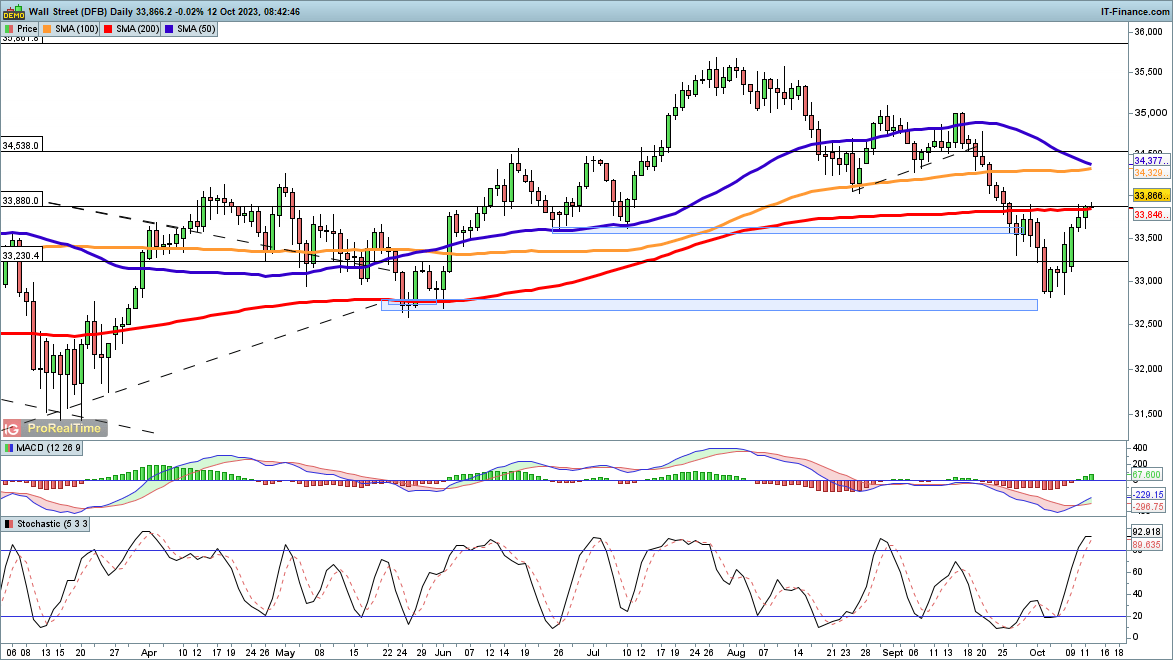
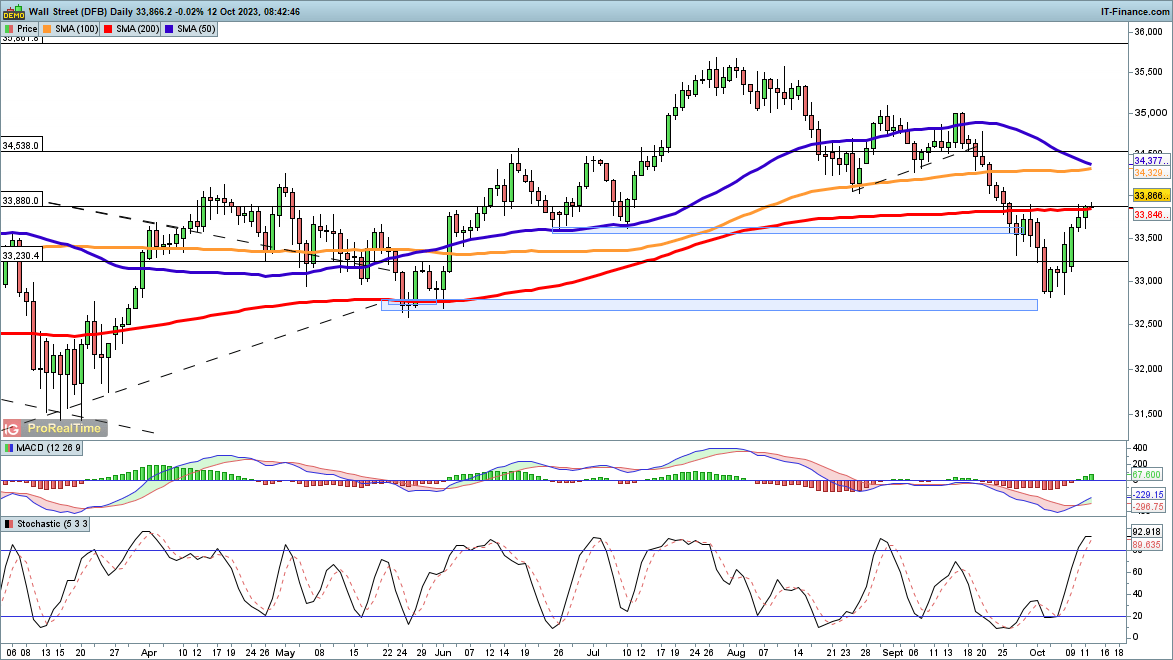
Dow edges above 200-day moving average
The impressive rebound for the Dow has carried the index back to the 200-day simple moving average (SMA).Early trading on Thursday has seen the price edge above this indicator, though a close above it eludes the bulls for the time being. Additional upside targets the mid-August low around 34,100, and from there the 50- and 100-day SMAs come into view.
A reversal back below 33,500 would signal that sellers have reasserted control.
Dow Jones Daily Chart
Recommended by IG
Get Your Free Equities Forecast
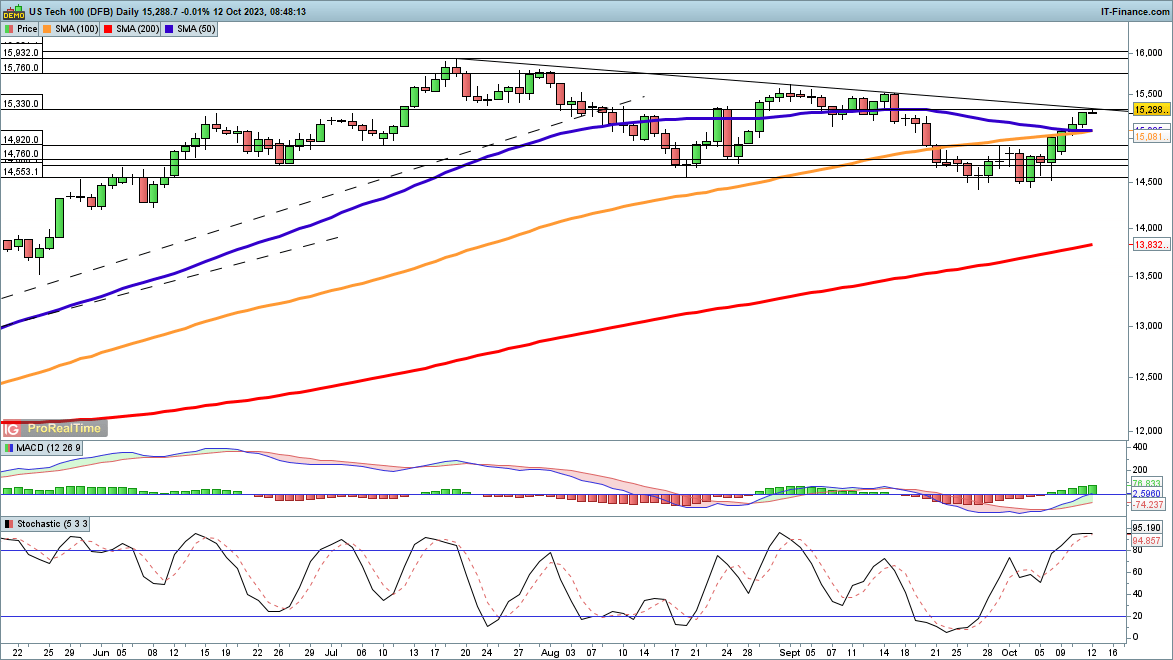
Nasdaq 100 reaches trendline resistance
The index has managed to surge above the 50- and 100-day SMAs in its rebound from the lows of late September. It has now reached trendline resistance from the July highs; in late August and September, this resulted in a lower high being formed. A close back below 15,050 would mark a lower high in this instance and open the way to another test of the lows of September around 14,500.
If the buyers can manage a close above trendline resistance, then a bullish view could emerge, with the price then targeting 15,500, the previous lower high. Above this, the July highs come into play.
Nasdaq 100 Daily Chart
Recommended by IG
Top Trading Lessons
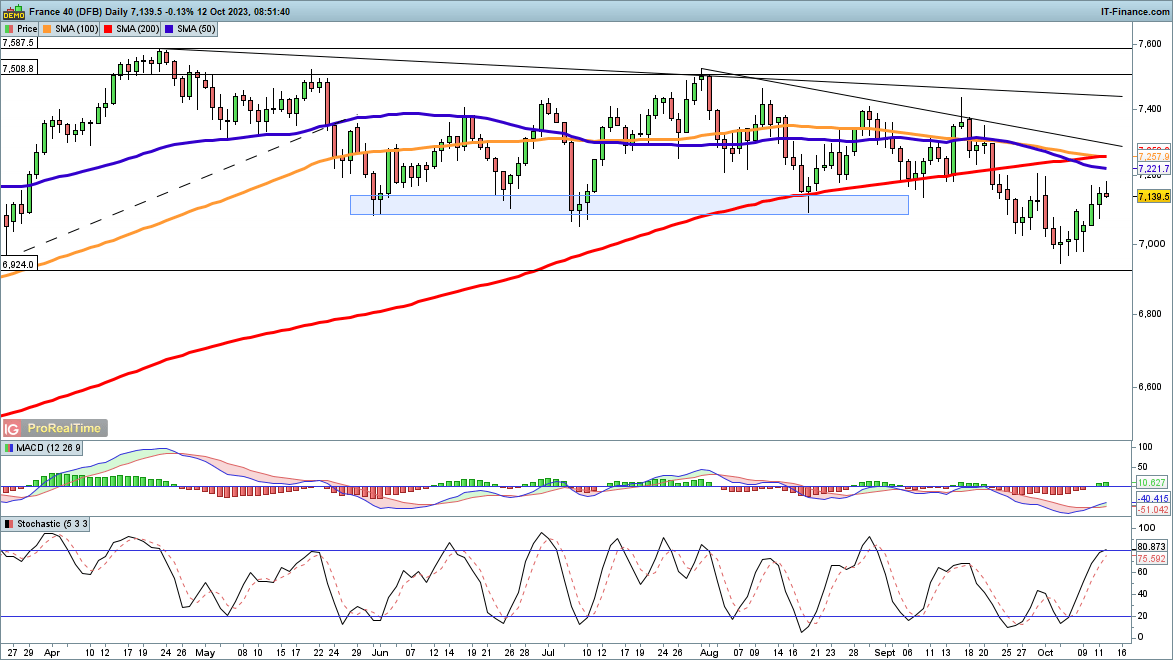
CAC40 rally slows
Like other indices, the CAC40 has succeeded in rallying off its lows, though it remains below the 200- and 50-day SMAs.The short-lived bounce in late September ran out of momentum below 7200, so a failure to close above this area would be a bearish development. This might then result in a fresh drop towards the 7000 level and the September low around 6965.
Additional gains above 7200 would target the 50-day SMA, then the 200-day SMA, and then on to trendline resistance from the late July high.
CAC 40 Daily Chart

Comments are closed.