Dow, Nasdaq 100 and Nikkei 225 Look for Further Gains
Article by IG Chief Market Analyst Chris Beauchamp
Dow Jones, Nasdaq 10, Nikkei 225 – Prices, Charts, and Analysis
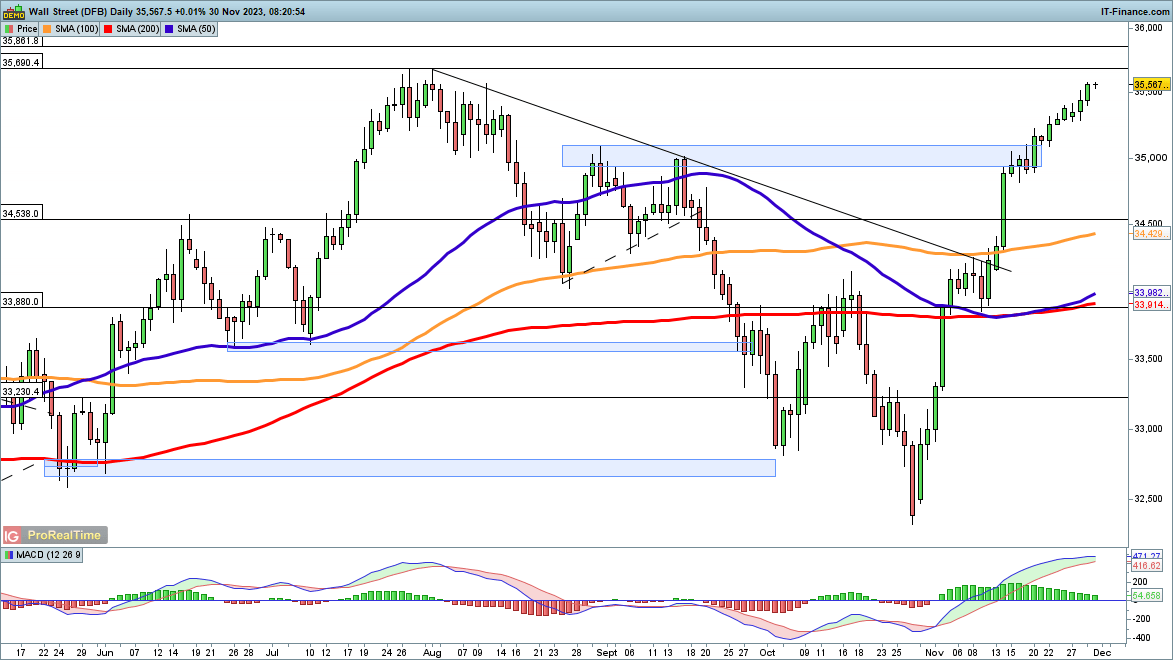
Dow on the up once more
The rally has recovered this week, canceling out expectations of at least a short-term pullback.The July highs at 35,690 are now just a short distance away, and a move back here would mark the recovery of all the summer and early Autumn losses. Above this the next target is 35,860, and then on to the record high at 36,954.
Once more any hope of a pullback has been dashed, with little sign at present in price action that one is at hand. It would need a close back below 35,300 to suggest that one may be close.
Dow Jones Daily Chart
Recommended by IG
Get Your Free Equities Forecast
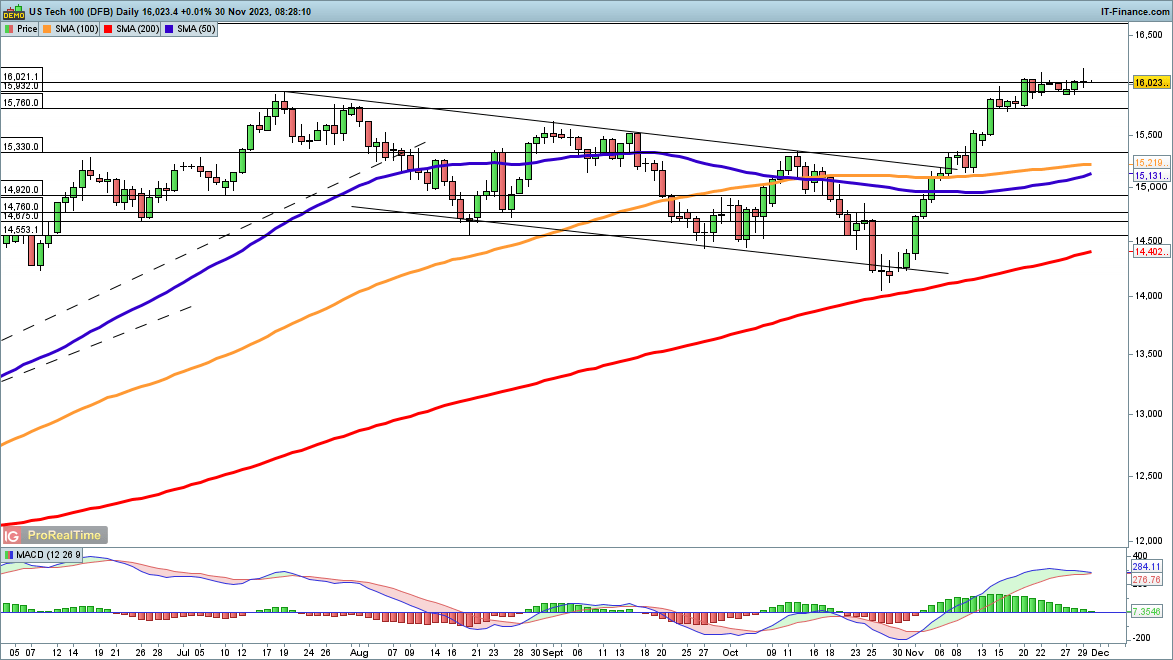
Nasdaq 100 holds around 16,000
The price is consolidating around the 16,000 level, having surpassed the July high in mid-November. For a short-term bearish view, the price would need to reverse course and head back below 15,760. This might then see a reversal towards the October highs at 15,330.
Having cleared 16,000, the index’s next hurdle to the upside would be 16,630, the record high from 2021.
Nasdaq 100 Daily Chart

Recommended by IG
Traits of Successful Traders
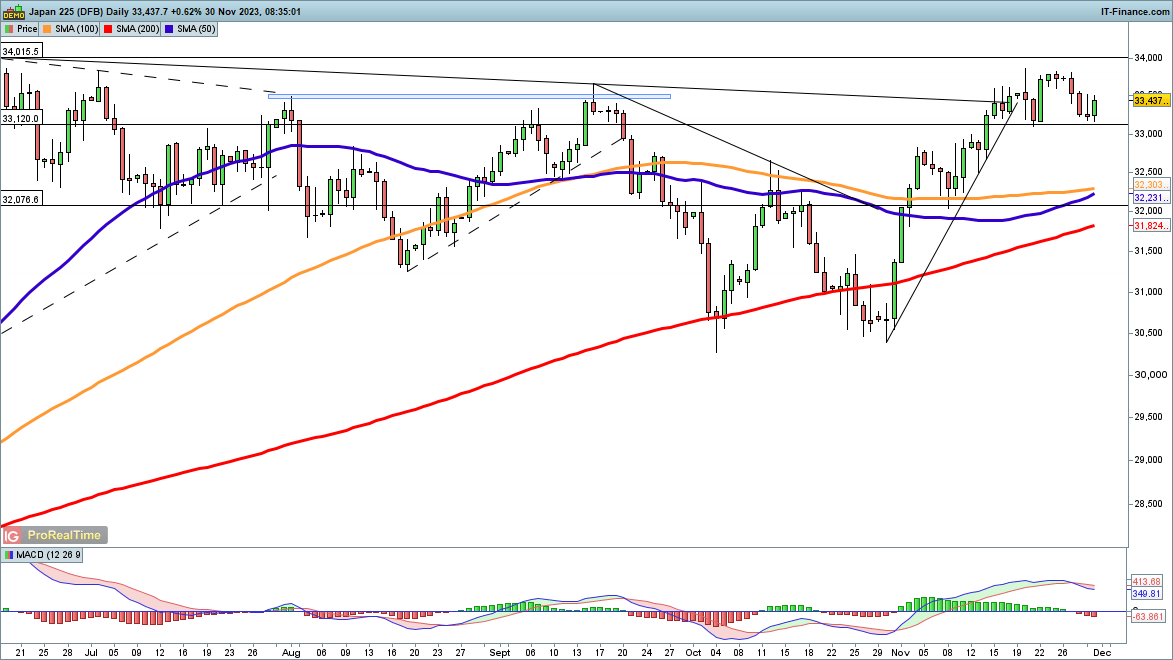
Nikkei 225 rallies off support
After dropping back towards 33,000, the index has moved higher, holding support for the time being.Renewed gains above last week’s high (33,800) once more leave the index on course to hit the June high at 34,000. Beyond this lies the 1989 high at 38,957.
Sellers would need a renewed close below 33,120 to suggest a new attempt to push lower is underway.


Comments are closed.