Double top emerges, around 90.00, after a 2% rally
- If AUD/JPY fails to crack 90.00, that will pave the way for a double-top confirmation.
- For a bullish continuation for the AUD/JPY, a break above 90.00 would expose the 200-day EMA at 90.86.
The Australian Dollar (AUD) posted gains vs. the Japanese Yen (JPY) on a risk-on impulse, spurred by softer US economic data revealed during Thursday’s North American session. Therefore, high beta currencies like the AUD were bolstered by speculations that the US Federal Reserve (Fed) will hike rates again, followed by a pause—that increased investors’ appetite for riskier assets. As the Asian session begins, the AUD/JPY exchanges hand at 89.94.
AUD/JPY Price Action
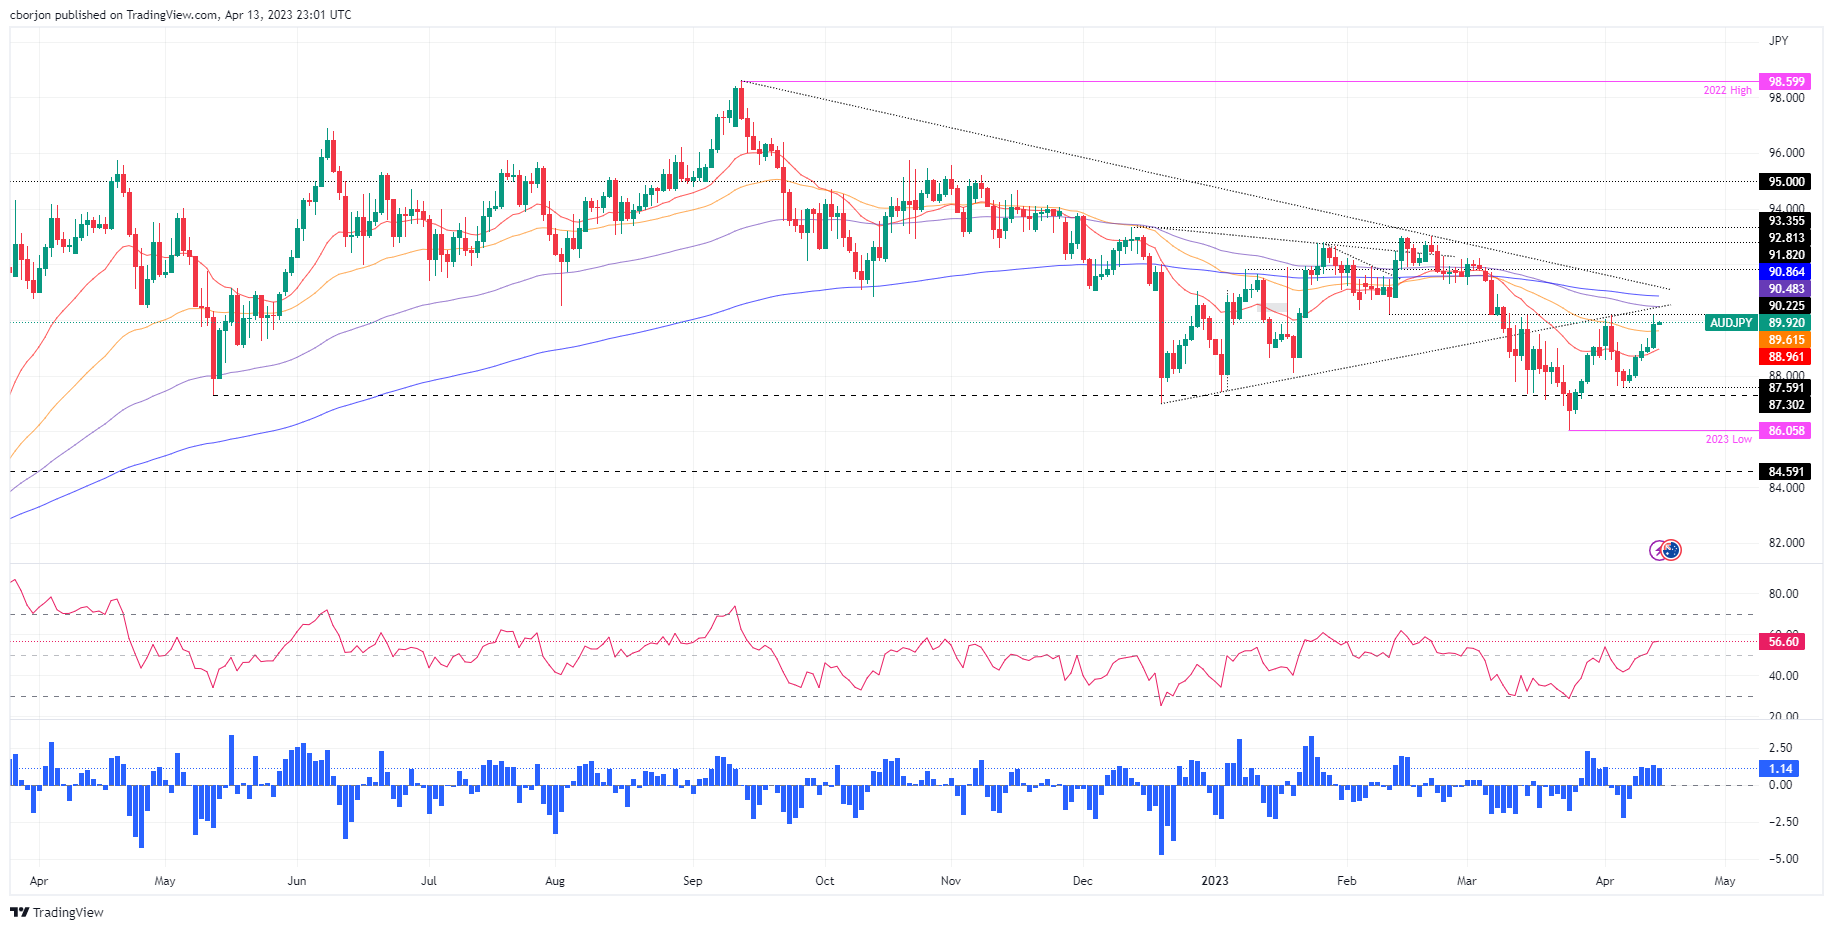
The AUD/JPY recent rally from April 6 swing low at 87.50 was capped by April’s 4 daily high at 90.17. Although the cross-currency pair challenged the latter, the AUD/JPY dipped below 90.00. That depicts the formation of a “double top” chart pattern, which could exacerbate a fall toward the 2023 lows at 86.06.
Oscillator-wise, the Relative Strength Index (RSI) is in bullish territory, though shifted flat. At the same time, the Rate of Change (RoC) portrays that buying pressure in the latest rally was made on lower volatility. That said, the AUD/JPY could be set to a downward correction in the near term.
If AUD/JPY drops below the 50-day Exponential Moving Average (EMA) at 89.61, sellers would be in charge, but they will need to crack support at the 20-day EMA around 88.96. The next floor in the near term would be the 88.00 figure, followed by a test of the April 6 low at 87.59.
For a bullish continuation, the AUD/JPY might reclaim 90.00. A breach of the latter will expose the 90.17 weekly high, followed by a test of the 100-day EMA.
AUD/JPY Daily Chart

AUD/JPY Technical Levels


Comments are closed.